The LitTER Project: A field method for using litter-fall to study carbon cycling
by Lee Cain & Nick Baisley
Astoria High School Science Department
ABSTRACT
During a NASA funded Teacher-Researcher Partnership program focused on bringing Global Warming and Climate Change into the classroom, a long-term ecological study was created to get students into the field to research leaf litter fall as it relates to the carbon cycle.
Through photosynthesis, carbon in the atmosphere is converted into plant matter, which then will fall to the ground as it continues to be recycled in the carbon cycle. Our investigation is designed to answer the following question: “What is the rate at which carbon as leaf litter moves from a coniferous forest canopy to the forest floor (C-flux as Mg/ha/yr)?” A secondary question we are hoping to answer with this study is: “How does the rate of C-flux relate to coniferous age and management techniques?”
For comparison we selected one 60+ yr. old stand, a 30-50 yr. old recently thinned stand, and a young closed-canopy regenerating clearcut (15-20 yrs. old). In each stand we laid out two parallel transects, each with nine litter traps (plots) spaced 10 meters apart. Along each transect we also placed a HOBO temperature and light data logger.
We are collecting, drying, sorting, and finding the mass of leaf litter, and other sources of carbon, that have fallen into the traps. With only one fully completed set of data, we have yet to begin to answer the key questions of this study. We foresee a period of at least five years before we gather a significant data base. The purpose of this preliminary year was to choose our sites, establish transects, and work through any logistical or methodological challenges that present themselves. In the fall, students will begin taking regular field trips to the sites in order to collect and analyze the data.
 ig forests, big trees. Steep slopes, moss, and mycorrhizal strands of hyphae exposed under sliding boots. Climb up the slope, scramble down the log, lay the tape out, and spread the calipers. Then back up the slope again over the crisscrossed giant pick-up sticks to get the next measurement.
Later, taking a break for lunch, smashing microscopic biting midges against our sweaty arms, we have the chance to gaze upwards at the giant columns and wonder about what each tree has witnessed in its four or five centuries of existence. Then lunch is over, and it’s time to lay the tape out again.
This goes on day after day. Two science teachers from Astoria High School, we were in the H. J. Andrews Experimental Forest in the Cascade Mountains. This forest is part of the Long Term Ecological Research (LTER) Network, created by the National Science Foundation (NSF) in 1980 to conduct research on ecological issues that can last decades and span huge geographical areas. We were working with Dr. Mark Harmon of Oregon State University’s College of Forestry to take follow-up carbon storage measurements on forest research stands that had not been measured since the ‘70s and ‘80s.
In the following week in the computer lab, we take apart the measurements and put them back together again. On graphs, the data slowly begins to crystallize in our minds. We begin to realize that the carbon cycle is not working in the same time-frame as our short lives. It takes time for change to happen. Perhaps much more time than we have to repair the damage that we have done in a relative blink of an eye.
We now notice forests differently. We see logs in a way we did not before. Or rather, we see their absence. Replanted and managed forests appear to be empty – something is just missing. It is not just a sense of something missing – one can visibly notice the absence. No giant pick-up sticks lying crisscross on the forest floor. Such a void of stored carbon.
Back in the classroom, our challenge was to get students to see the actual carbon cycle as we have, and not just as an abstract diagram in a textbook. Then they might just be able to understand their own role in the cycle. We knew that time would be the enemy, because we never seem to have enough of it. But if we can get them to see the carbon falling, even one leaf at a time, then we will have begun the process. So we came up with the “LitTER Project,” a long-term ecological study (9th grade Integrated Science) of the movement of carbon from the forest canopy to the forest floor as falling leaves (litterfall). We realized it might take 5 years or more before we acquire any really significant database, but hoped that the process of getting kids to actually handle the litterfall would set into motion a greater awareness of the carbon cycle.
Our key investigative question was, “What is the rate at which carbon as leaf litter moves from a coniferous forest canopy to the forest floor (C-flux as Mg/ha/yr)?”
A secondary investigative question was, _“How does the rate of C-flux relate to coniferous age and management techniques?”
METHODS
Litterfall Traps — Three sites were selected within the Astoria area to give a wide range of forest ages and management approaches, yet also to be close enough to the high school to be practically accessible. For comparison we selected one 60+ yr. old stand, a 30-50 yr. old recently thinned stand, and a young closed-canopy regenerating clearcut (15-20 yrs. old).
At each site, two transects were laid out parallel, 20 m apart. All transects were set to have a 360 N orientation to be consistent in terms of solar angle of incidence. Nine litterfall traps (plots) were spaced along each transect at 10 meter plot intervals.
Each litterfall trap consisted of a black plastic rectangular floral tray (43 cm by 43 cm ~0.2 m2) lined with window screen to keep all litterfall from passing through the grid of the floral tray. Two wire surveyor flags were used to anchor through the trap into the forest floor and hold the mesh in place. The fluorescent flags helped to aid finding the traps on later visits. In addition, a surveyor’s ribbon with plot identification was tied to a nearby branch. Each plot was cleared of branches for 1 meter above the center of the trap.
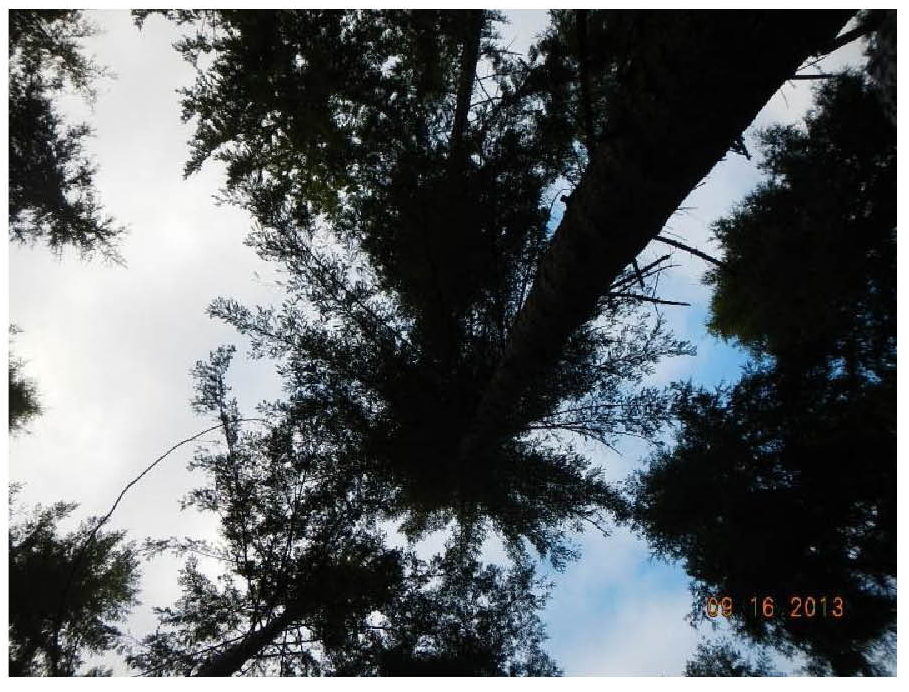
A canopy cover photograph was taken by standing directly over the trap and shooting straight up. A HOBO temperature and light data logger was also placed next to each transect. This photograph can be digitized for percent cover using Photoshop or a similar software. Percent cover can then be used to draw relationships with carbon flux rates.
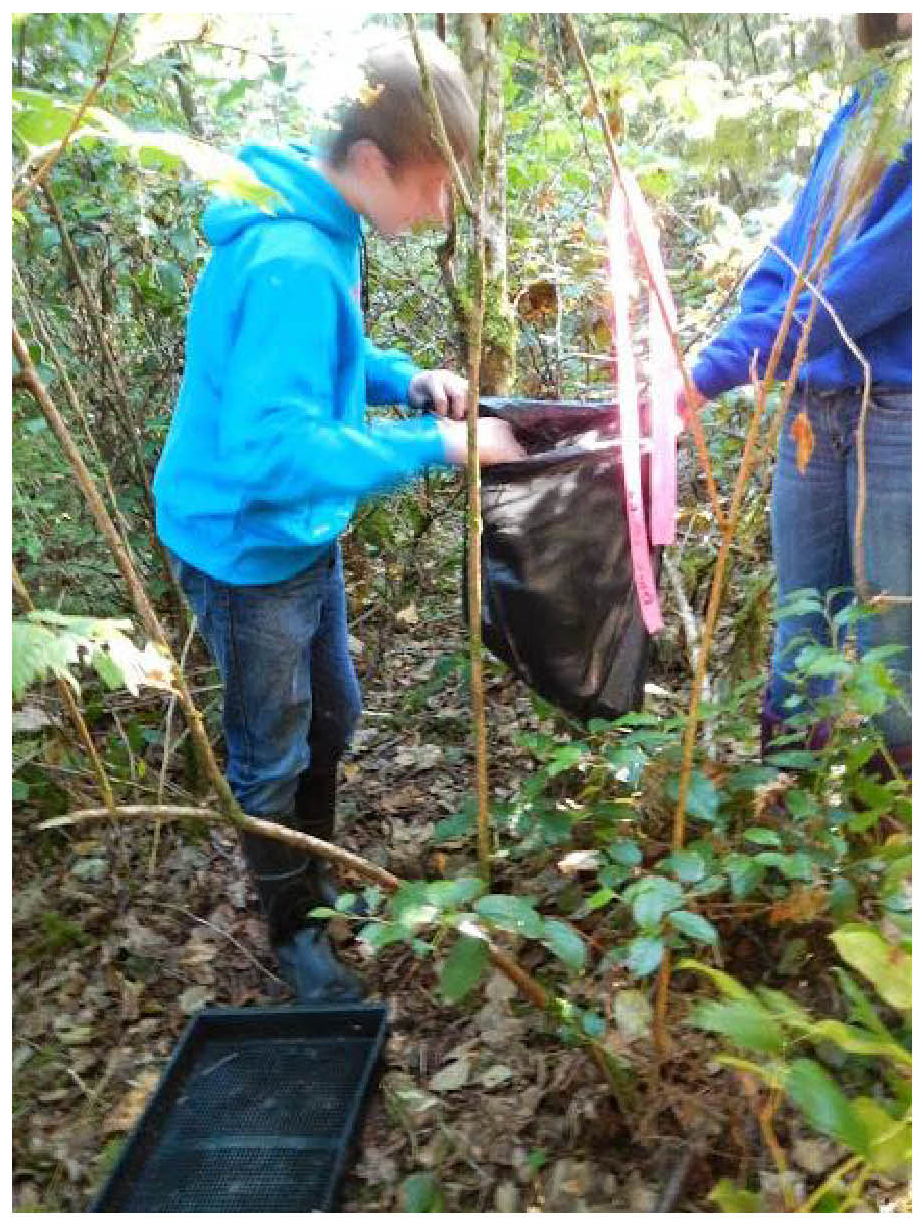
Student Visits — Students were bussed to the study sites and allowed about 1.5 hours to collect the first samples from the traps. Each team of 2-3 students was responsible for collecting the samples from one plot, and re-setting the trap to level and clearing the forest floor to level, flagging the branch above the plot and taking the canopy cover photograph.
Processing Samples — Litter from the traps was placed into black plastic bags labeled with masking tape and trap information. The empty trap was returned to exactly the same position until the next collection date. The bags were tied shut and taken back to the lab, where they were then spread out to dry for two weeks at an average temperature of 25 C. In teams, students then sorted and weighed the litter samples to the nearest 0.1 grams (Table 1) in the following categories: needles, broadleaves, total leaf, woody matter, reproductive (seeds, flowers, etc.), total plant, mineral matter, and animal (bug parts).
GRAPHS AND FIGURES
Table 1 – Teams of students were given single data tables to initially record the sorted raw weights:
Table 2 – Excel was used to summarize the raw data:
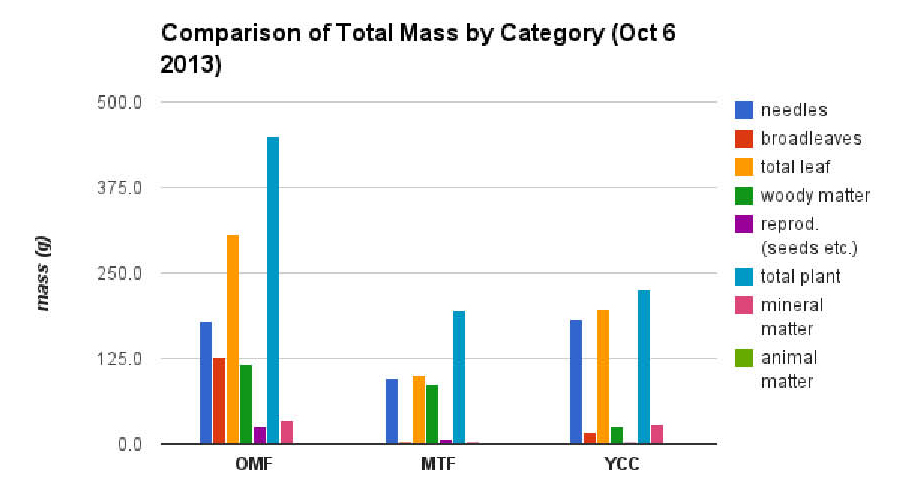
Figure 1 – Graph of summarized results of the first month of data collection:
DISCUSSION
While only one data collection had been completed at the time of publishing, the tables and figures in the previous section should give an idea of how we have arranged the data.
The most obvious result in the data, though it is early yet, is that there are apparently significant differences between study sites in terms of total leaf mass compared to woody matter. Over time, these differences should develop into differences in the rate of carbon flux in the three different systems. This should not be surprising, yet is exactly these sorts of differences that students will likely not be able to see prior to participating in a LitTER project. Because there is only one sample event so far, we have not yet constructed picture of the carbon flux as litterfall over time. What is not known at this time if these differences maintain their relative distances or if it equalizes over time.
 While we are looking forward to pulling out these and other relationships from the data, we are mostly excited by the potential of this project as a tool to get students involved in science inquiry. Students become highly engaged during the data collection and processing. There are also many directions that we can go with the student learning about climate change with this project as a base.
There are still a few areas in the project protocol that we need to revise. Originally, the data collection was planned as a monthly activity that rotated between six Integrated Science classes throughout the school year. But it immediately became apparent that this didn’t work with the busy pace of school and the unforeseen effect of weather (windstorms, rain, snow days).
It is also a major organizational effort to get even one class of student scientists out to the nearest of the sites, let alone bussing six different classes to all of them. To adjust to this, we are now planning on making the data collection quarterly. Three times throughout the year, we teachers will team to collect the data (about 2 hours per site). This approach may eventually fall into the form of a senior project, to be carried out by a capable science-minded individual or group of individuals. Our 9th grade students will now experience the field data collection just once per year, on a fall day devoted to the project. While this is not as ideal as more frequent field trips, we feel that this is a balance we have to make to accommodate the public school setting of our project. At least this way the students have that field experience to help them to better relate when participating in the multiple data analysis events in the laboratory.
REFERENCES
Muller-Landau, H.C. and S.J. Wright. (2010) Litterfall Monitoring Protocol, March 2010 version.
F.S. Peterson, J. Sexton, K. Lajtha. (2013) Scaling litter fall in complex terrain: A study from the western Cascades Range, Oregon. Forest Ecology and Management 306, 118-127 Online publication date: 1-Oct-2013.
This article was submitted for ED 901 – Researcher Teacher Partnerships: Making global climate change relevant in the classroom Spring 2014 ; Oregon State University & Oregon Natural Resources Education Program (ONREP)


