Middle School Students Use Historic Snowpack Data to Gain Inquiry, Graphing and Analysis Experience
by Joe Cameron
Beaverton Middle School teacher

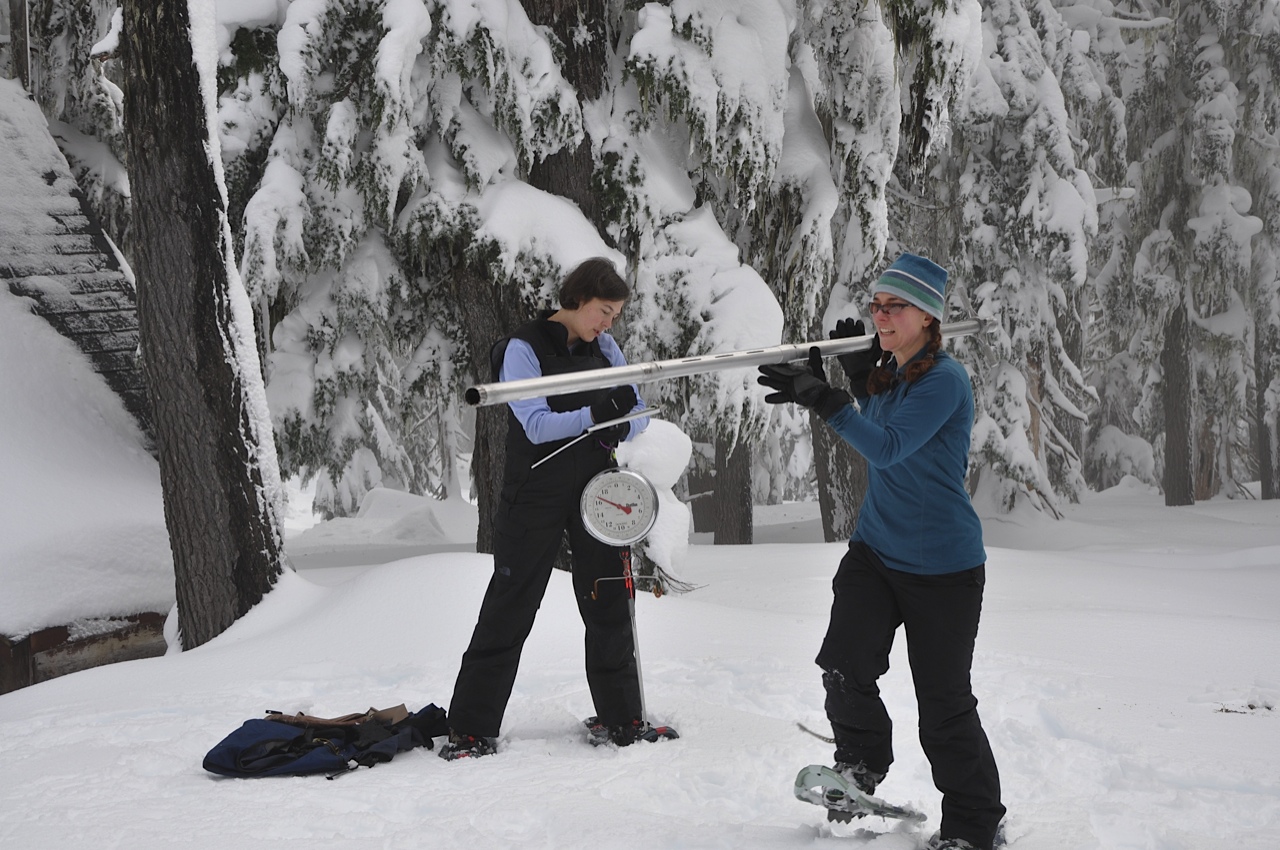
NRCS Oregon hydrologists Melissa Webb and Julie Koeberle measure snow on Mt. Hood. Courtesy of USDA.
What do you get when you mix researchers, teachers, authentic science opportunities and a group of GREAT people? You get three summers of intense work, reinvigorated teachers, new ideas for the classroom and lots of fun!
For the last three summers I was lucky enough to be involved in the Oregon Natural Resource Education Program’s (ONREP) Climate Change Institute where teachers are matched with researchers to bridge the gap between the classroom and field research. The last two years I worked with Oregon State University’s Dr. Anne Nolin and Travis Roth examining snow pack changes in the McKenzie River Watershed. Investigating snow collection sites and collecting data led to discussions on how best to get students involved in authentic research and science inquiry investigations.
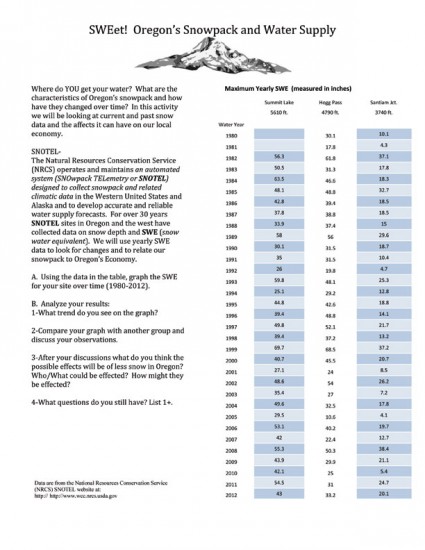
One of my goals for the year was to get my students involved in authentic data collection and to gain more experience and practice in graphing. From this, SWEet! was born. SWEet is an activity that engages students in using historic snow data to investigate the SWE, or Snow Water Equivalent, and the changes taking place in the Cascade Mountains in Oregon. Students graph and analyze data from SNOTEL sites and compare their findings with others in class to make predictions about future snowpack. In extension activities students choose their own SNOTEL sites in the Western U.S. and monitor snow data monthly throughout the snow year. This type of activity will in turn introduce students to long-term ecological studies in progress and support them to begin studies of their own.
In doing this activity with my students we first investigated their particular sites. I found this helped them personalize the data and they were very involved, especially using this “local” data. Then using their data they were able to create comparative line graphs and look for trends in the data, even with a complex and varied data set. These trends were then used to hypothesize possible effects of changes in the snowpack to their world and the economy and ecosystems found in Oregon.
SWEet! Oregon’s Snowpack and Water Supply
Author: Joe Cameron
Time: 50+ minutes
Grade Level: 6-12
Background
SNOTEL-The Natural Resources Conservation Service (NRCS) operates and maintains an automated system (SNOwpack TELemetry or SNOTEL) designed to collect snowpack and related climatic data in the Western United States and Alaska in order to develop accurate and reliable water supply forecasts. For over 30 years, data on snow depth and SWE (Snow Water Equivalent) have been collected from SNOTEL sites throughout the western US. This activity will use yearly SWE data from three SNOTEL sites in Oregon to look for changes and relate our snowpack to Oregon’s economy and environment.
Introduction
Familiarize students with Snow Water Equivalent (SWE), which is the amount of water contained in the snowpack. A simple reference for background information is http://www.nrcs.usda.gov/wps/portal/nrcs/detail/or/snow/?cid=nrcs142p2_046155. Also, you can do a simple class demonstration by taking a 500ml beaker of snow (or blended ice) and melting it using a hot plate. I have students predict how much water will remain after the ‘snow’ is melted. Then, we calculate the percent water in the snow to give them an example of one way to analyze this type of data.
After getting the students comfortable with SWE, you can give them the SWEet! Oregon’s Snowpack and Water Supply activity page. When I led this activity, we read through the introduction as a class and then directed the students to graph the data provided, make sense of their plot, compare their results with others in class and then draw conclusions. This lesson leads to discussions of our changing climate and possible changes in store for the people, plants and animals of Oregon.
Objectives
Students will access long term ecological data.
Students will graph SWE data.
Students will compare their data with data from their classmates.
Students will identify possible effects of a decrease in snowpack.
Vocabulary
SWE-Snow Water Equivalent; the amount of water found in snow.
SNOTEL-automated system that records snow depth and related data in the western United States
Trend-a general direction that something is changing
Snowpack-the amount of snow that is found on the ground in the mountains; usually measured at specific sites.
Standards
Next Generation Science Standards (NGSS)
MS-ESS2-5. Collect data to provide evidence for how the motions and complex interactions of air masses results in changes in weather.
MS-ESS3-5. Ask questions to clarify evidence of the factors that have caused the rise in global temperatures over the past century.
Oregon Science Standards
Scientific Inquiry: Scientific inquiry is the investigation of the natural world based on observations and science principles that includes proposing questions or hypotheses, designing procedures for questioning, collecting, analyzing, and interpreting multiple forms of accurate and relevant data to produce justifiable evidence-based explanations.
Interaction and Change: The related parts within a system interact and change.
6.2E.1 Explain the water cycle and the relationship to landforms and weather.
7.2E.2 Describe the composition of Earth’s atmosphere, how it has changed over time, and implications for the future.
7.2E.3 Evaluate natural processes and human activities that affect global environmental change and suggest and evaluate possible solutions to problems.
8.2E.3 Explain the causes of patterns of atmospheric and oceanic movement and the effects on weather and climate.
8.2E.4 Analyze evidence for geologic, climatic, environmental, and life form changes over time.
Materials
For Demonstration:
1 500 ml beaker
1 50-100 ml graduated cylinder snow OR chopped/blended ice
1 hot plate
For Activity:
Copies of SWEet! Oregon’s Snowpack and Water Supply activity page
Graph paper
Optional: colored pencils/pens
Lesson Procedure
1. Give students the SWEet! Activity page.
2. As a class, read and review all directions.
3. Students may choose 1, 2, or 3 sets of data to graph. This option allows the activity to be modified to meet the individual students’ abilities. Also, students can create graphs that can be compared to multiple data sets.
4. Students graph the data in a line graph.
5. Students analyze the data. This part can be completed through drawing a trend line(s) on the graph, calculating averages, adding totals and/or comparing multiple data sets looking for similarities and differences. Note: having the students do their graphing using Excel spreadsheets is an option that is not always available in our school but from which the students would benefit.
6. Relate the observed trends in snowpack to possible effects in Oregon. Who/What will be affected? How will/might they be affected?
7. Students pose one other question OR concern they have after looking at their graphs and trends for possible additional exploration.
Extensions
1-Related current event articles from Science Daily:
Warming Climate Is Affecting Cascades Snowpack In Pacific Northwest
Found at http://www.sciencedaily.com/releases/2009/05/090512153335.htm
Global Warming to Cut Snow Water Storage 56 Percent in Oregon Watershed
Found at http://www.sciencedaily.com/releases/2013/07/130726092431.htm
2-Students can access current snow year data online. They go to SNOTEL website, choose a specific site and collect daily, weekly or monthly data for this site throughout the winter months (the snow year stretches from November to March). Students can also access historic data going back to the late 1970’s and early 1980’s for their sites.
References Science expertise was provided by the following Oregon State University Faculty: Dr. Anne Nolin – Professor and Travis Roth-Doctoral Student in the College of Earth, Ocean, and Atmospheric Sciences. Data are from the National Resources Conservation Service (NRCS) SNOTEL website at: http://www.wcc.nrcs.usda.gov
Acknowledgements These lessons were created using information learned in the Oregon Natural Resource Education Program’s Researcher Teacher Partnerships: Making Global Climate Change Relevant in the Classroom project. This project was supported by a NASA Innovations in Climate Education award (NNXI0AT82A).
Thanks to Dr. Kari O’Connell with the Oregon Natural Resources Education Program at Oregon State University and Dr. Patricia Morrell in the College of Education at University of Portland for their thoughtful review of this article.
Joe Cameron is a teacher at Beaverton Middle School in Beaverton, Oregon. He can be contacted at joe_cameron@beaverton.k12.or.us


