Climate Change Education
SWEet!: Using Cascade Snowpack to Teach Climate Change
by Padraic Quinn, Rachel Carson Environmental Middle School
Padraic_Quinn@beaverton.k12.or.us
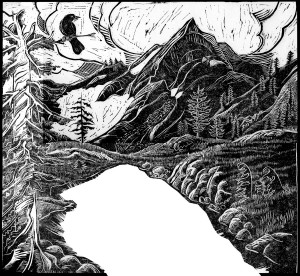
Illustration by Bill Reiswig
Three years ago I was given the opportunity to learn with the scientific leaders of climate change research as part of a teacher-research partnership through NASA, Oregon State University and the Oregon Natural Resources Education Program (ONREP). I heard scientists talk about how forests act as carbon sinks or carbon sources, how LANDSAT data are showing us changes to our landscape, how ocean currents are affecting the availability of copepods eaten by salmon, and how the growth rings in the ear bone of a fish can be studied and correlated with the growth rings of trees on the nearby coast. All of these researchers were making discoveries that played a role in our knowledge of climate change. In addition, teachers were assigned to a scientist each year to conduct research over a two-week period. This allowed both the teachers and researchers to discuss their work and determine ways that it could be transferred from climate researcher work to middle school student work. This sharing of information included access to the scientists and their work, even when I returned to my classroom.
Transferring Professional Development to the Classroom
A significant portion of my classroom science curriculum is spent on independent research projects where students work through the inquiry process to answer a question to a problem on a science topic of their choice. Prior to starting our projects this year I assessed students on their graphing and analysis skills by teaching lessons on climate change in the Northwest, primarily using the Natural Resources Conservation Service (NRCS) SNOTEL system. This automated system, under the technical guidance of the National Water and Climate Center (NWCC) provides snowpack and climate data in the Western U.S. and Alaska. SNOTEL provides real-time data that is critical for understanding future water supplies and allows my students exposure to natural resource issues that will directly affect them and their families. Based on my experiences working with snow pack research, I designed a multiday lesson on climate change that used SNOTEL data to form the basis of the students’ inquiry.
Climate Change and NW Snowpack Lessons
Day 1
Each student was asked to build a concept map for climate change showing connections among different components. Examples were given for a concept we had just finished studying (photosynthesis) so they were clear on how to see and depict interactions. The concept maps varied drastically, partially due to the fact that my classes include a mix of 6 – 8 graders but also because of the wide range of knowledge about climate change knowledge among my students. The discussion after the students completed their concept map and pretest was valuable, with many students wanting to share, ask questions and verbalize their current understanding of climate change.
Day 2
Students were excited when they sat down, and I was in the back of the room with a very loud snow-cone machine. After they got over the initial disappointment of not getting a refreshing snow-cone, each table group was asked to agree on the volume of “snow” that was in the beaker I had filled and placed on their table. Students recorded their information along with a definition of SWE or Snow Water Equivalent. Our basic definition was the amount of water in the snow. Students also made a prediction of the SWE for the “snow” that was on their table. At the end of class, after melting, students determined the percent water content in their snow.
To show a real life example on a large scale of global climate change and melting I had students watch the TED Talk, “James Balog: Time-lapse proof of extreme ice loss”. Balog shows photographs from the Extreme Ice Survey that he began in 2005 and shared in his TED Talk from 2009. Students were asked to write down new information, “WOW” information and questions they had from the talk. Connections were made since some students had been to Alaska, while others had been in the Cascades Mountains; but the majority of the students did not realize that glaciers were present in the mountains located just 65 miles from where they were sitting in Beaverton, Oregon.
Days 3 & 4
To help connect students to their surroundings I had them pick an Oregon SNOTEL site out of a hat. The sites didn’t make sense to them yet but the names are intriguing with the likes of Jump Off Joe, Blazed Alder, Bear Grass and Mud Ridge. Students went online to gather general information about their SNOTEL site such as county, latitude-longitude, and elevation. The students also collected SWE, snow depth, YTD precipitation, and Max., Min. and Average Temperature (see attached student activity sheet). To get a view of the historical context of how SWE has changed over time students collected mean SWE for March in every year that SNOTEL data have been collected. In most cases this was approximately 1978. Students found wide variations in SWE from year to year but soon were asking about specific years from other sites and realized how data were similar from site to site. Many discussions revolved around why such large fluctuations exist, trends over time, temperature’s impact on SWE and elevation impact on SWE. These discussions were difficult for even some of the more accomplished 8th graders, but interest did not diminish due to complexity. Students graphed data, wrote a short analysis and compared data with another student whose site elevation differed (+/-2000’) from their own site.
Adopt-a-SNOTEL site: Long Term Snowpack & Water Availability Activities
As a follow-up to this activity students have been monitoring their SNOTEL sites since November daily for SWE, snow depth, YTD Precipitation and Observed Temperature. (See attached student monitoring sheet.) This work has continued to keep students interested and active in local mountain snowfall and their own SNOTEL site. Each month I am asking students to conduct activities and answer questions on their SNOTEL data. This includes graphing one or more of the parameters, discussing monthly trends in the data, comparing site data with another student and finding sciences article related to snowpack, glaciers and climate change. Students will conduct this activity throughout the winter and spring months as a way to continue their learning on climate change, make a connection to their sense of place and better understand how their water supply will be affected in the short and long term.
The range of benefits to me and my students provided by the Researcher-Teacher Partnerships project have been immeasurable. I have been given open access to an elite scientific community, the collaboration among educators has been inspiring, and my current and future students will continue to learn as researchers.
References
Natural Resources Conservation Service. (2013) SNOTELand Snow Survey & Water Supply Forecasting Brochure. National Weather and Climate Center, Portland, Oregon
http://www.wcc.nrcs.usda.gov/snow/about.html
Natural Resources Conservation Service SNOTEL Data, http://www.wcc.nrcs.usda.gov/snow/
TED Conferences, LLC. (2009) James Balog: Time-lapse proof of extreme ice loss http://www.ted.com/talks/james_balog_time_lapse_proof_of_extreme_ice_loss.html
Science expertise was provided by the following Oregon State University Faculty: Dr. Anne Nolin – Professor and Travis Roth-Doctoral Student in the College of Earth, Ocean, and Atmospheric Sciences
Acknowledgements
These lessons were created using information learned in the Oregon Natural Resources Education Program’s Researcher Teacher Partnerships: Making global climate change relevant in the classroom project. This project was supported by a NASA Innovations in Climate Education award (NNXI0AT82A).
Student Activity Sheet Attached
SNOTEL Activity for Oregon.docx
SNOTEL MONITORING SHEET.docx
SNOTEL SWE for Oregon name: _______________________
SITE MONITORING
Use this to record data for your SNOTEL site for the next month. In the table below you will find the information you will need to record for your site. This should be collected at least once per week for each day that week.
1. Go to Google Search and type Oregon SNOTEL
2. Click on first site shown which will be a map of Oregon
3. Use the drop down menu Select a SNOTEL Site to find your site by name. Or if you know where your site is located you can click on the correct red dot on the map.
Site Name: ____________________________________ Site Number: ___________________________
County: _______________________________________ Elevation: _______________________________
Latitude: _____________________________________ Longitude: _______________________________
5. Click on Last 7 Days under the Daily column for Snow Water Equivalent. Record the following.
| Date | Snow Water Equivalent (in) |
Snow Depth (in) |
Year-to-Date Precipitation (in) |
Observed Temp (degF) |


