
by editor | Sep 5, 2025 | Climate Change & Energy, Conservation & Sustainability, Critical Thinking, Data Collection, Environmental Literacy
Integrating Watershed Science in High School Classrooms
The Confluence Project Approach
High school students in northern Idaho learn about watersheds and the impacts of climate change through an intensive field science program that aligns with the Next Generation Science Standards.
by Audrey Squires, Jyoti Jennewein, Mary Engels,
Dr. Brant Miller and Dr. Karla Eitel
“It’s not just because I personally love snow and skiing and snowshoeing and all that. It’s not just because I love to teach science outdoors in the field. It’s not even just because I value connecting my students with real scientists every chance I get. It’s honestly not any one of these particular things alone that has made the Snow Science field trip the absolute favorite part of my Environmental Science curriculum over the last four years. Instead, it’s the simple notion that for this generation of teenagers in the Inland Northwest, the impacts of climate change on the hydrology of snow within our watershed might be the most valuable social, economic, and ecological topic to cover in the entire school year. Snow is the backbone of our way of life in North Idaho, and the sense of awareness and empowerment my students develop as a result of this Confluence Project three-lesson unit is absolutely critical for their growth and progress as young adults heading into the 21st century.”
– The Confluence Project Teacher,
Advanced Placement Environmental Science
Clean water matters, immensely, to all of us. We desperately need education that promotes deep understanding of how water is important to students. Fortunately, water as a theme is easily incorporated into numerous scientific disciplines. From the basics of the water cycle in foundational science courses to the complexities of cellular processes in advanced biology; and from energy forecasting with anticipated snow melt in economics to the nuances of water as a solute in chemistry, water is foundational to a variety of subjects and can be incorporated into the learning objectives with a little creativity and willingness to step outside the box.
Over the past three years in high schools across Northern Idaho we have been working to develop a water based curriculum that has the flexibility to be used in many types of classroom, and that provides students with firsthand experience with water and water related issues in their local watershed. The Confluence Project (TCP) connects high school students to their local watersheds through three field investigations that take place throughout an academic year. These field investigations are designed to integrate place-based educational experiences with science and engineering practices, and focus on three themes: (1) water quality, (2) water quantity, and (3) water use in local landscapes. During these field investigations, students actively collect water, snowpack, and soil data and learn to analyze and interpret these data to the ‘big picture’ of resource quality and availability in their communities.
 Before each field investigation, students are exposed to the pertinent disciplinary core ideas in class (National Research Council [NRC], 2011; NGSS Lead States, 2013), explore issues present at field sites, read relevant scientific articles, and learn field data collection techniques. Students then collect data in the field with support from resource professionals. After each field investigation, students analyze their data and use the results to discuss how to solve ecological issues they may have encountered. Adults guide students through this process at the beginning, with the goal that students will develop the necessary skillset to conduct independent, community-based, water-centric research projects by the end of the academic year (Figure 1). Students are ultimately challenged to creatively communicate their research projects, including both the scientific results and their proposed solutions to environmental issues encountered in their watershed, at a regional youth research conference (e.g. Youth Water Summit).
 Originally created to serve as a sustainable method to continue outreach efforts from a National Science Foundation Graduate STEM Fellows in K-12 Education (GK-12) grant (Rittenburg et al., 2015), the development of TCP coincided with the release of the Next Generation Science Standards (NGSS) (NGSS Lead States, 2013). With a strong emphasis on science and engineering practices, disciplinary core ideas, and coherent progressions (Reiser, 2013), the TCP model closely aligns with these new standards. Given that much of the curriculum developed for the older National Science Education Standards is content-focused (NRC, 1996), TCP fits the need to create curriculum that includes opportunities for students to explain how and why phenomena occur and to develop the critical thinking skills associated with scientific investigations.
Pedagogical Framework
Sobel (1996) wrote that “authentic environmental commitment emerges out of first hand experiences with real place on a small, manageable scale” (p. 39). In TCP, authentic learning often emerges as students engage in first-hand exploration. Using the local watershed as a lens for field investigations enables students to connect with their landscapes and develop new depths of understanding of the world around them. By connecting students’ lived experiences and local landscapes with scientific information we are able to generate a unique learning setting, which in turn sparks continued interest in exploring the familiar from a new perspective. As one student from the 2015-16 program wrote:
This localized learning approach is often referred to as place-based education (PBE), which engages students in learning that utilizes the context of the local environment (Sobel, 1996; Smith, 2002). PBE seeks to connect students to local knowledge, wisdom, and traditions while providing an authentic context to engage students in meaningful learning within their everyday lives.

TCP also uses a project-based learning (PBL) approach (Bell, 2010) to help students frame the field investigations and the subsequent analysis and interpretation of collected data as foundations for their own research projects. These practices emphasize student construction of meaningful and usable scientific concepts and, perhaps more importantly, relating these concepts to their own lived experience. For example, one student wrote the following reflection after a class water quantity field investigation:

These types of reflections demonstrate an internalization of curriculum unit topics, which in turn motivates students to continue learning.
Importantly, PBE and PBL are used as frameworks to align lessons with the NGSS. The pedagogical features of PBL match well with the eight science and engineering practices at the core of the NGSS framework, which include: (1) asking questions and defining problems; (2) developing and using models; (3) planning and carrying out investigations; (4) analyzing and interpreting data; (5) using mathematics and computational thinking; (6) constructing explanations and designing solutions; (7) engaging in argument from evidence; and (8) obtaining, evaluating and communicating information (Bybee, 2011). In TCP, these pedagogical approaches provide a meaningful context for students to engage in developing understandings of disciplinary core ideas, while the curriculum creates new, effective ways to enact the NGSS.
Empirical evaluation of student learning in the program (Squires et al., under review) indicates that after participation in TCP, students expressed greater concern for local ecological issues, recognized the efficacy of science as a tool to address environmental issues in their communities, and were more engaged in science when PBE and PBL pedagogies were used.
Project Implementation
“Yesterday my entomology class went to a local creek to study the bugs and life around it. It was really cool to fish a lot of bugs out of the water. We got lots of benthic macroinvertebrates such as a mayfly (dragonfly), damselflies, all in different instars (sic) [stages of growth] …. We tested the pH of the water, the transparency of the water, and the dissolved oxygen in it…This was really a fun project, it was great getting all of the bugs I’ve been learning about and it was really cool to use my knowledge about them… I suggest that anyone should go and do this, you could learn a lot about your region’s water quality.”
–TCP Entomology Student
 TCP curriculum aligns with several Performance Expectations and Disciplinary Core Ideas from the NGSS (Table 1), and can also easily adjust to fit within multiple courses. TCP curriculum has been incorporated into less flexible, standards-driven courses like Biology and Chemistry, as well as more flexible courses like Environmental Science, Entomology, and Earth Science. While each class participates in the same three units (water quality, water quantity, and water use), teachers tailor these units to the learning objectives of their courses.
For example, environmental science teachers have been able to tie the water quantity unit to global climate change, land and resource use, and local economics. Students analyzed collected snowpack data to determine how much water would be available in their watershed for growing crops and sustaining lake and river-based tourism economies. They also compared their data to historical figures to understand how climate change has impacted water availability in their watershed over the past several decades.
By contrast, TCP biology teachers have successfully incorporated TCP units as part of their yearlong curriculum aligned with rigorous biology standards. For example, as part of the water use unit one teacher discussed sustainable water use in an agriculture setting by focusing on concepts like plant growth and cellular function. Other teachers have presented photosynthesis, primary productivity, and fisheries biology during the water quality unit, and speciation, biodiversity, and habitat as core topics during the water quantity unit.
Even in very specialized science classes there is room to engage with this curriculum. For example, one entomology teacher was able to highlight the role of macroinvertebrates as indicators of stream health when teaching the water quality unit. He taught students insect characteristics, discussed growth and metamorphism, and then showed students how to tie flies in order to solidify that knowledge in a unique, hands-on way. The class then visited a stream near their school to identify macroinvertebrates and learn their importance in evaluating water quality. Last but not least, TCP curriculum was designed for the potential of cross-course collaboration, which gives students the opportunity to apply and link concepts and skills learned in science class to their other courses while developing critical thinking skills. Several program teachers have collaborated with colleagues in their schools to integrate content across disciplines and open students’ eyes to interdisciplinary study.
 Connecting with local professionals
The most valuable thing that we learned on our field trip to [the restoration site] was learning about the processes that were taken to restore the creek, and why they did it… We think that this field trip has shaped our understanding of these careers by actually experiencing the job and their daily tasks that can do good to the environment (sic). Following the field trip, we can say that we have a better understanding of just how time consuming and difficult the process of restoration in an area such as [the restoration site] can be. –TCP student water quality field investigation post trip reflection
Teachers often struggle to plan activities beyond the day-to-day classroom lessons, which is one reason why local professionals and leaders are an essential facet of TCP. Agency scientists, Tribal land managers, and graduate students provide scientific support to teachers and students during field investigations, in-class pre- and post-lessons, and final research projects. This gives students an opportunity to collaborate with and learn from specialists and practicing scientists in their communities, allowing the students to gain experience carrying out science and engineering practices alongside experts. In addition, students learn about career opportunities and restoration efforts in their local watersheds from TCP partners.
Examples of past TCP partners include universities (extension, graduate students, and professors); Tribes (environmental agencies and Elders); state agencies (environmental quality and fish and game); federal agencies (Natural Resources Conservation Service, United States Forest Service, Bureau of Land Management, and National Avalanche Center); and local organizations (environmental nonprofits, homeowner’s associations, and ski resorts).
Since these collaborations are critical to the success of TCP program we have developed a Reaching Out to Potential Partners checklist to help teachers contact and recruit community partners. The checklist helps teachers develop a coherent narrative to use with busy professionals which highlights the mutual benefits of collaboration.
Keeping costs to a minimum
Admittedly, implementation requires some capital investment to cover essential program costs such as busing, substitute teachers, and field equipment. However, these costs can be minimized with some creative organization. Multiple TCP schools have been able to eliminate busing costs by using streams near or on school property. Supportive administrators can creatively minimize substitute teacher costs (in one case the principal agreed to cover the class instead). Field equipment is certainly necessary to collect data (see Resources), but the equipment required may potentially be borrowed from agencies or university partners. A classroom supply budget or a small grant from the booster club or other local organization can also help cover such costs and build supplies over several academic years. While regional youth research conferences, such as the Youth Water Summit are excellent ways to motivate students, it is possible to get the research benefits without the associated costs. We suggest inviting partners and other local experts to attend research project presentations at school. This way students can still benefit from external feedback as well as gain research and presentation skills.
Conclusion
TCP has provided a valuable framework for school-wide exploration of local water-related issues. TCP provides hands-on, place-based and problem-based learning while addressing key Next Generation Science Standards and preparing students for the kind of inter-disciplinary problem solving that will be increasingly necessary to address the complex challenges being our students will face as they become the workforce and citizens of the future.
Resources
The full TCP curriculum including lessons, standard alignment, field trip planning, and other recommendations can be found at: http://bit.ly/2cNdNIm
Interested in learning more from the TCP’s leadership team? Contact us at theconfluenceproject@uidaho.edu
Acknowledgements
A program like this requires dedicated and creative teacher and program partners. Without the enthusiastic commitment of our past and present teachers and partners TCP would never have been actualized. We’d like to thank Rusti Kreider, Jamie Esler, Cindy Rust, Kat Hall, Laura Laumatia, Jim Ekins, and Marie Pengilly for their aid in program design and implementation, as well as for continued programmatic effort and support. Furthermore, thank you to Matt Pollard, Jen Pollard, and Robert Wolcott; along with graduate students Paris Edwards, Courtney Cooper, Meghan Foard, Karen Trebitz, Erik Walsh, and Sarah Olsen for your dedication to TCP implementation. In addition, we would like to acknowledge funding from the NSF GK-12 program grant #0841199 and an EPA Environmental Education grant #01J05401.
Audrey Squires, Jyoti Jennewein and Mary Engels are past program managers of TCP. Squires is currently the Restoration Projects Manager for Middle Fork Willamette Watershed Council while Jennewein and Engels are PhD students at the University of Idaho (UI). Dr. Brant Miller, UI science education faculty, was the Principal Investigator of the EPA grant that funded TCP in 2015-16. Dr. Karla Eitel is a faculty member and Director of Education at the McCall Outdoor Science School, a part of the UI College of Natural Resources.
References
Bell, S. (2010). Project-based learning for the 21st century: Skills for the future. The Clearing House, 83(2), 39-43.
Bybee, R. W. (2011). Scientific and engineering practices in K–12 classrooms: Understanding a framework for K–12 science education. The Science Teacher, 78 (9), 34–40.
NGSS Lead States. (2013). Next Generation Science Standards: For states, by states. Washington, DC: The National Academies Press.
National Research Council. (1996). National Science Education Standards. Washington, DC: National Academy Press.
National Research Council. (2011). A framework for K-12 science education: Practices, crosscutting concepts, and core ideas. Washington, DC: The National Academies Press.
National Science Teachers Association (NSTA), 2013. Disciplinary Core Ideas in the Next Generation Science Standards (NGSS) Final Release. http://nstahosted.org/pdfs/ngss/20130509/matrixofdisciplinarycoreideasinngss-may2013.pdf Accessed 22 April 2016.
Reiser, B. J. (2013). What professional development strategies are needed for successful implementation of the Next Generation Science Standards? Paper presented at the Invitational Research Symposium on Science Assessment. Washington, DC.
Rittenburg, R.A., Miller, B.G., Rust, C., Kreider, R., Esler, J., Squires, A.L., Boylan, R.D. (2015). The community connection: Engaging students and community partners in project-based science. The Science Teacher, 82(1), 47-52.
Smith, G. A. (2002). Place-based education: Learning to be where we are. The Phi Delta Kappan, 83 (8), 84–594.
Sobel, D. (1996). Beyond ecophobia: Reclaiming the heart in nature education (No. 1). Orion Society.
Squires, A., Jennewein, J., Miller, B. G., Engels, M., Eitel, K. B. (under review). The Confluence Approach: Enacting Next Generation Science Standards to create scientifically literate citizens.

by editor | Sep 1, 2025 | At-risk Youth, Climate Change & Energy, Equity and Inclusion, Indigenous Peoples & Traditional Ecological Knowledge, Language Arts
First-person narratives bring climate change closer to home.
By Lauren G. McClanahan
“So, is her house actually sinking?”
“Yes, Heather, it is.”
“But, that’s so sad! I want to do something about that!”
No doubt my preservice secondary education student, Heather, is familiar with the topic of climate change. Everywhere we look, we see media coverage. But there still seems to be something missing. There still appears to be a disconnect, for my preservice teachers, anyway, between what they read about online and what they see in their day-to-day lives. And this has huge implications for their futures as public school teachers. One way to address this disconnect has been to put a face to the topic of climate change. By connecting all of my “Heathers” to students who live in places where climate change is having actual, observable effects, a topic that was once only theoretical to many of my students becomes real.
Kwigillingok, Alaska, vs. Bellingham, Wash.
My teacher-ed students at Western Washington University in Bellingham, Wash., come from multiple walks of life, are at different points in their educational and working careers, and have different goals for their futures as middle and high school teachers. However, one commonality that my students tend to share is their geography. Most hail from western Washington state—up and down the “I-5” corridor. Take the freeway north, and in 15 minutes, you’re in Canada. A few hours south, and you’ve crossed into Oregon. On a daily basis, my students don’t give much thought to climate change. No doubt, many claim to be “green” through-and-through. They recycle, use compact fluorescent bulbs, and buy local whenever possible. And these efforts are important; but as for the big changes—the catastrophic ones happening in our circumpolar regions—my students just don’t see it. In contrast, the students of Kwigillingok, Alaska, see these changes every day and can document firsthand how their village is changing because of them.
Kwigillingok is a small Yup’ik fishing village in western Alaska that sits along the Bering Sea. With a population of about 400, the residents depend on a subsistence culture to survive, much as they have done for thousands of years. Fishing, hunting, and creating and selling crafts are as integral today as they have been for centuries. However, our warming earth is now threatening that culture.
I began working with the students of “Kwig” several years ago, when one of my former students was hired to teach in the Lower Kuskokwim School District. What started as a simple pen-pal relationship between her high school students and my college students slowly transformed into the project described here. And while the students have changed over the years, the questions that they were asking of one another became more focused, until we decided that the topic of climate change was the main issue that everyone wanted to discuss.
The biggest challenge faced by the residents of Kwig is the melting of the permafrost, that layer of frozen ground that lies just below the earth’s surface and that is supposed to stay frozen year-round. Recently, that permafrost has begun to melt, and as a result, major changes are taking place. Many homes and other structures in the village are beginning to sink, leaning to one side as the permafrost they were built upon begins to shift. In addition to sinking homes, new, invasive species of plants are beginning to take root and grow, which in turn is slowly changing the migratory patterns of big game such as the local musk ox populations. Fishing, too, has been affected by the warming trend, and fish camps have had to relocate depending on the changing location of the fish. These are big changes that can be seen and felt and experienced daily in the lives of Kwig’s high school students. It was these changes that they wanted to tell us about, to tell the future teachers “down there” to share with all of their future students. They wanted to let everyone know that climate change is real and has a face and a name—hence the “First Person Singular” project. This was a project to create a warning for the rest of us, those of us who do not have to prop our houses up with sandbags or who do not have to go hungry due to a lack of fish in our rivers. Or at least not yet.
The “First Person Singular” Project
As mentioned, the relationship between Kwig and WWU began when a former student of mine was hired into the district. I had always been interested in Native cultures and found this to be an opportunity to weave that interest into the literacy classes that I teach. The more the students shared with us about their culture and their harsh, yet beautiful landscape, the more I felt as if I had to visit. In an initial visit, I met with the teachers and students at several village schools. I saw firsthand what the students of this region had to share with my students, not only from a cultural perspective, but also a scientific one as we delved deeper into the issue of climate change and its effect on their culture.
Recently, one of my current students approached me about completing his student teaching internship at the Kwig school. “I just want a very rural, very challenging school setting,” he told me. Well, did I have the place for him! Luckily, my intrepid student would not mind hauling his own water, which is what he would have to do, since many of the buildings in Kwig have no running water. He did, however, have the luxury of a newly installed incinerator toilet in his cabin—preferable to a Honey Bucket. Before he left, my student (a future English teacher) and I had talked about doing a project with his students that would combine disciplines and allow the students’ own voices to be heard. The concept of place-based education, of focusing curriculum on local issues, had been an important part of our university classes, and my student wanted to try it out. He liked the combination of using the local setting as the classroom, and letting his students “direct” their learning—two of the main components of place-based education. So, with his students’ input, a project was decided upon, and I made plans to come up and help facilitate the project after he eased into his new role as student teacher. I figured that another visit would give me an opportunity not only to formally observe my student teacher, but also work in person with this project and these students that I had been thinking about for some time.
Before I traveled to Kwig for the second time, I asked the high school students (with whom I communicated by email) to photograph any evidence of climate change that they could see in their village. Then, once I arrived, my student teacher and I sat down with each student to talk about the photos they had taken. This technique of using “auto-driven photo elicitation” (as it is called in the field of visual studies) proved to be beneficial. Auto-driven photo elicitation is simply when people involved in a research study take their own photographs, and use those photos as the basis for later interviews (Clark, 1999). The photos gave us a starting point—something on which to focus our conversation. Otherwise, I was afraid that the conversation might become too abstract, or even too uncomfortable (seeing as how the students had never met me face-to-face, but only through email). However, by focusing on the photos, we were able to get to the heart of what was important to the students. After all, we were talking about their photos, of evidence of climate change in their village.
After we spent time talking about the photos (individually and as a group), I asked students to pick a favorite photo and write about why it was the best choice to illustrate the effects of climate change. Because we had talked about the photos first, the writing part was easy. They could describe, in detail, why their photos mattered, and why their audience, my preservice teachers, needed to know about them. Then, after they had written their paragraphs, I asked students to read their paragraphs (or parts of their paragraphs) into a digital voice recorder so that we could incorporate their own voices (literally) into our final product. One of the students even volunteered to play the piano so that our project would have a soundtrack.
One of the students photographed a leaning building. He described it this way:
“The world is changing. It’s getting warmer and warmer. Ice is melting everywhere, even underground. The melting of the permafrost causes hills, houses, and other buildings to sink. Permafrost is a section in the ground where everything is frozen. It melts and refreezes around the year, but lately, there has been more melt than freeze. If we don’t do something, we could lose this beautiful land that we lived in for thousands of years, forever.”
 He then wrote the same paragraph in his native Yup’ik language, and read them both aloud. This was powerful. Another student photographed seagulls that were hanging around later in the season than usual. She explained that “it’s unusual for them to still be here [in October], which suggests that [the ground] is not as cold as it looks.
Once the paragraphs had been written and recorded, students responded to several prompts that they created themselves, such as, “What is worth preserving in Kwig?” One student responded, “We don’t have a lot of money. We need to stay near the ocean so we can fish. We don’t want to have to move farther and farther back every few years. We can’t leave, but we can’t stay, either.” When asked what message they wanted to send to the preservice teachers in Washington, one student said, “Please understand that what you do down there has a great impact on us up here. Understand that we’re all in this together. Climate change doesn’t just affect polar bears—it affects people, too.”
The project’s final phase was to put our photos, words, and voices into a very short iMovie. The students helped plan the sequencing, and then we put it together. And while the “film” was only four and a half minutes long, it sent a strong message to the preservice teachers it was meant to educate. After viewing the movie, one of my preservice teachers wrote, “Now that I know this—now that I have seen these kids’ faces and heard their stories—I can’t ‘un-know’ it. Now I have to decide what I can do about it, both in my classroom, and in my everyday life.”
Larger Implications
Place-based education, while not a new concept, is particularly well-suited for the inclusion of student voices. With its aim of grounding learning in local phenomena and students’ lived experience (Smith, 2002), it can be easily adapted to fit any number of school curricula. For example, nearly every city or town has local issues that can be studied in greater depth, be they environmental issues (toxic wastewater), social justice issues (migrant workers’ access to health care), or issues dealing with the economy (how city taxes are used to fund local schools). In the case of our project, climate change was an obvious topic for exploration, given our fortunate connection with students in the far North. Plus, the topic fits nicely into the definition of “sustainability education.” Within WWU’s Woodring College of Education, our underlying assumption is that education for sustainability (as opposed to education about sustainability) will result in citizens who are more likely to engage in personal behavior or contribute to public policy decisions in the best interest of the environmental commons and future generations (Nolet, 2009).
Personal Implications
When students take control of their learning, and take control of how that learning can be demonstrated, amazing things can happen. For the Kwig high school students, they learned that they had not only some very important things to say, but also an audience that was receptive to and respectful of their words and ideas. For my preservice teachers, they learned that they are not the experts on everything, and sometimes they have to step aside to let the experts step forward (in this case, the students themselves). This idea of relinquishing power in the classroom can intimidate a new teacher, but it is an important lesson, especially regarding student engagement.
After viewing the high school students’ film, my preservice teachers had a lot to say about place-based education, and how this project connects students to their local communities, and society as a whole. One student commented, “Obviously, the kids in the movie care about what is happening to their homes and land. We need that heart in schools, or what they are learning means nothing.”
Many students also commented on the topic of climate change. “Now I know why I take the time to recycle! It’s not much, but it’s a small step I can take to help preserve the world’s cultures.” Another student said, “Now that I know this—about the challenges facing Kwig due to climate change—I feel obligated to do something about it.” Climate change now has a name and a face. It’s personal.
Similar projects that focus on topics of local concern could be created within other curricula. Any place-based study could benefit from hearing the voices of those most affected. Travel to each place is certainly not mandatory. Using even simple technology such as email or Skype could connect classrooms across town or across the world. Because, in the end, it is all about the relationships that can be forged as a result of storytelling. The more we know about others through their stories, in their own voices, the more inspired we might be to recognize those voices in our own.
References
Clark, C. (1999). The autodriven interview: A photographic viewfinder into children’s experience. Visual Sociology, 14, 39-50.
Nolet, V. W. (2009). Preparing sustainably literate teachers.Teachers College Record, 111(5).
Smith, G. A. (2002). Place-based education: Learning to be where we are. Phi Delta Kappan (April), 584-594.
Lauren G. McClanahan (Lauren.mcclanahan@wwu.edu) is a professor at Western Washington University in Bellingham, Wash.

by editor | Mar 31, 2021 | Climate Change & Energy, Conservation & Sustainability, Environmental Literacy
PEI Offers Food Waste and Climate Change Storyline Workshop for Teachers
Despite being one of the wealthiest countries in the world, the United States is also one of the most wasteful. America holds the dubious distinction of throwing away more food than every other nation except Australia, an average of a pound per person each day. In total, 150,000 tons of food gets dumped daily in the U.S., the equivalent of a third of the calories we consume.</p style>
 What many may not realize is how those actions contribute to the climate crisis. Now, thanks to an innovative workshop through the Pacific Education Institute (PEI), that may change. In December, 5th-grade teachers and high school teachers from Clark County and surrounding areas explored PEI’s food waste and climate change lesson plans and storyline through a free two-day professional development workshop. PEI is an award-winning statewide organization that helps teachers, schools and districts integrate place-based STEM education into their curriculum.
Funding for the workshop was provided through the Office of the Superintendent of Public Instruction’s (OSPI) ClimeTime initiative.
The training offered teachers an opportunity to explore the science using data, hands-on activities, and Traditional Ecological Knowledge (TEK), according to PEI’s Lower Columbia Regional Coordinator Chad Mullen. “We spend a good part of the time building teacher capacity,” he explains. “We don’t assume that teachers will arrive having background knowledge of why food waste is worth focusing on or the science behind decomposition and we don’t assume that they’ll come with a diverse background of cultural values around food and waste.”
At the workshop, teachers gained tools to help students understand the issue by applying math and science. For example, in one activity they measured how much energy, water and land goes into one pound of milk in a school lunch and how much atmospheric CO2 will be produced if it’s thrown out. “We help teachers understand the tools we’ve gathered for them to use with their students,” says Mullen.
Participants learned about the tremendous resources that go into food production through seeds, water, energy and land and how to calculate the greenhouse emissions from the food that is thrown away. “Wasted food is a big part of the climactic impact,” says Mullen. “We are providing students an opportunity to understand how individuals, classrooms, and schools can be part of the climate solution.”
Food waste ends up in one of two places: the compost bin or the landfill, both of which are problematic. “If it goes into the compost, the carbon that plant pulled out of the air to make food is all going to decompose and turn back into atmospheric carbon or carbon that’s being held in the soil,” says Mullen. The decomposition process releases CO2, a recognized greenhouse gas.
But that’s not nearly as bad as what happens when food goes into a landfill. In the absence of oxygen, as it breaks down it gets converted into methane, which in the atmosphere is 104 times more destructive than CO2 over a twenty-year time span.
At the workshop, teachers gained tools to help students understand the issue by applying math and science. For example, in one activity they measured how much energy, water and land goes into one pound of milk in a school lunch and how much atmospheric CO2 will be produced if it’s thrown out. “We help teachers understand the tools we’ve gathered for them to use with their students,” says Mullen.

Cinnamon Bear, PEI’s tribal liaison for western Puget Sound region.
Another central aspect of the workshop is incorporating indigenous perspectives about food and waste. Cinnamon Bear served as PEI’s Tribal Liaison for the western Puget Sound region during the first year they offered the training. “Food waste is a prime example of how we have disconnected from our local environments and the ecosystems that provide the gifts of food and medicines that sustain us,” she says. “It’s something we can all have a very real and important impact on.”
This is the fifth food waste workshop PEI has offered and whenever possible, they include a local tribal elder or leader who can speak to the issue. When that’s not an option, participants view TEDtalks from indigenous leaders and teachers who share their perspectives. Bear says that expanding teachers’ ideas of what constitutes science has been an important first step.
“Giving hands-on, specific experiences is the method I’ve found most successful,” she says. “Having teachers make cordage from nettle, enjoy a traditional meal so they can experience how indigenous communities view food as a gift, or make a salve from cedar during a TEK lesson, all of that makes this knowledge personally relevant and motivating to the teachers who have such important work to do with our youth.”
The workshop also included collaborations with several community partners. Staff from the Clark County Green School shared their work in diverting food out of the waste stream and participants toured the Clark County Food Bank to learn about their strategies to redirect food waste toward those who need it most. Finally, they heard from Josh Hechtman, a 17-year-old high school senior who started Reproduce 81, a club at Lewis and Clark High School in Spokane to send food that would normally be wasted at school home with students who would otherwise go hungry.

Teachers in the workshop heard from Josh Hechtman, a 17-year-old high school senior who started Reproduce 81, a club at Lewis and Clark High School in Spokane to send food that would normally be wasted at school home with students who would otherwise go hungry.
The collaborative approach is typical of PEI’s educational model, which brings together schools and districts with conservation groups, resource management companies, and other community leaders to deliver real-world, outdoor-based STEM education rooted in local ecosystems and the industries that have grown around them. Previous workshops have yielded extraordinary results; in Chewelah, after fifth-grade students saw all the food waste they were producing, they produced a breakdown of how much it was costing the district per person – roughly the salary of one full-time teacher.
The class ended up meeting with representatives from the Spokane Tribe and managers from their local Safeway before presenting their findings to Governor Inslee. They also shared their discoveries with an international audience at the annual North American Association for Environmental Education conference.
Mullen and Bear anticipate inspiring results once Clark County teachers begin implementing what they learn in December. “I hope to see teachers and their students come out of this experience with a better understanding of some cultural values that might be different from theirs,” says Mullen, “and for our students from indigenous backgrounds to see themselves represented in the curriculum.”
Bear sees strong potential for young people to take the lead. “I want them to know they were born for this time and have a direct impact in the world we are creating and leaving for our future descendants,” she says. “I hope they realize their power and engage with the world around them with respect and reciprocity.”
 To learn more, visit PEI’s website, the ClimeTime website or call 360.705.9294.

by editor | Sep 26, 2019 | Climate Change & Energy
Violence, environmental violence, and pro-environmental action
Richard Kool
Royal Roads University
 hile there are many tasks on the plate of any educator, there are two that, to me at least, really seem essential and that are often overlooked; these tasks are for the educator to both reveal things that might be hidden to the student while being always open to revelation ones’ self, and to provide the student with tools for seeing hidden things.
A domain that seems to be hidden from environmental educators is that of environmental violence: the term ‘’violence’ never appears in the titles or abstracts of our major conferences, and virtually never appears in our published literature. Yet I would argue that environmental education, from its outset, grew out of a concern for the results of the violence our society inflicts on the natural world, a violence that both diminishes the ability of humans to fully function within society and diminishes the ability of the natural world to regenerate itself and thrive.
Thinking about violence
There are many definitions of violence; for example, the World Health Organization (WHO) states that violence is
the intentional use of physical force or power, threatened or actual, against oneself, another person, or against a group or community, that either results in or has a high likelihood of resulting in injury, death, psychological harm, maldevelopment or deprivation.
An important part of this definition, though, is the idea of intent; the implication is that if there is no intent, there is no violence. The peace scholar Johan Galtung offers another definition that avoids the necessity of an actor’s intent:
I see violence as any avoidable insult to basic human needs, and, more generally, to sentient life of any kind, defined as that which is capable of suffering pain and can enjoy well-being, lowering the real level of needs satisfaction below what is potentially possible. (Galtung & Fischer, 2013, p. 35, emphasis added)
Both of these definitions offer a set of lenses through which we can understand human violence, which always involve harm to someone or something, and that that harm reduces the ability of an individual to satisfy their needs.
While the world faces many violent settings and contexts, environmental violence in the 21st century puts not only humans, but a great deal of life on earth, at risk. Humans have long had powerful influences on environments, but these influences were primarily local or at the most regional. The historical record is replete with the local destruction of environments which result in societal collapse (Tainter, 1988), and some scholars tells us to not be sanguine about the potential of the future (e.g., Turner, 2012). Violence against the environment in this context is not a natural phenomenon, not something that happens as a natural process. Environmental violence is a direct outcome of human activity, with intent or not, that results in a diminishing of the potential for flourishing of both humans and all the other creatures that inhabit a particular environment.
Forms of violence
For Galtung, the simplest and most obvious form of violence is direct violence, the violence that we do, the intentional violence that we can see and we can directly inflict, violence that can be promulgated through words, knives, handguns, stealth missiles, pesticides and carbon dioxide. Environmental educators can easily imagine direct violence against nature: our textbooks and presentations, to say nothing about the Internet, are full of images of direct violence. In a western Canadian context, the expansion of the Alberta tar sands are an extraordinary form of direct violence causing landscape-level harms, biodiversity-level harms and human harms, both social and health-related (Finkel, 2018). Although our individual acts of direct violence (we would like to believe) may be few and small, it’s hard to get through the day in our contemporary world without some form of direct environmental violence.
But violence is not always done with a knife or gun; “neglect, inaction, gross inequality and unjust structures of society, including from lack of freedom and democracy” (Fischer, 2013, p. 12) can also be forms violence. Beyond direct violence, there is the structure of society, and not simply the words or actions of a particular person, that enact violence on people and planet. This is violence that seemingly just happens, with nobody particularly responsible for it. Galtung calls this structural violence. “There are two reasons for this: it is structural in the sense that no specific actors are indicated, and also in the sense that for the concrete actors that happen to be performing roles in the structure in question no specific motivation is necessary” (Galtung, 1980, p. 183). And not only are no specific actors involved nor does anyone have a particular desire to create environmental harm, any outcome (like a day’s worth of CO2 from driving to and from work) that results from either one’s direct or structural violence is not particularly large; the impacts of all of us that drove to work today cannot individually be detected in the carbon budget of the atmosphere, or be directly related to the reduction of global biodiversity. This is akin to what Kahn (1966) talked about when he spoke of the tyranny of small decisions:
It is an inherent characteristic of a consumer-sovereign, market economy that big changes occur as an accretion of moderate-sized steps, each of them the consequence of ‘small’ purchase decisions- small in their individual size, time perspective, and in relation to their total, combined, ultimate effect. (pp. 44-45)
Structural violence can create many victims without any obvious perpetrators and since the victims are often not seen or even noticed (e.g., people in distant lands, organisms in distant habitats), the violence can seem to be invisible or at least, ignorable. Structural violence is subtle, harder to see than direct violence; we need new lenses that allow us to more-readily see these structural causes that are now obscured by both our worldviews, and by various societal screens and curtains, from our everyday vision. Structural violence can be the necessary outcome of the way a society is structured and these structures, for most citizens, are just the way things are. Structural violence hides in the background, directing our attention away from it and towards examples of direct violence which then grabs our concern and outrage.
We as teachers should be able to examine structural violence with our students as it is the one which leaves us feeling that nothing can be done and that no one is, themselves, actually doing anything particularly damaging. This is the kind of violence that was described by Hannah Arendt (1970, p. 38) when she spoke of the work of a bureaucracy as “an intricate system of bureaus in which no men, neither one nor the next, neither the few nor the many, can be held responsible, and which could be properly called rule by Nobody”. The system and institutions whose structures are causing havoc in the world weren’t intended to create havoc, and we can imagine that no one who actually is responsible for those systems wants such havoc to be occurring. Nonetheless, the unintended outcomes of many small yet significant decisions have led to a world structure that is in fact creating significant and long-lasting problems.
Galtung continued his study by revealing a final category, cultural violence:
The study of cultural violence highlights the way in which the act of direct violence and the fact of structural violence are legitimized and thus rendered acceptable in society. One way cultural violence works is to change the moral color of an act to green/right or at least to yellow/acceptable from red/wrong; an example being killing in the name of the country as right, in the name of oneself as wrong. Another way is by making reality opaque, permitting us not to see the act or the fact, or at least not as violent. (Galtung, 1990, p. 292)
While structural violence normalizes violence as being inescapable given the very construction of a particular society, cultural violence offers us the salve of justification, absolving us of responsibility for the violence. Justifying violence through cultural norms, we can avoid any sense of guilt that might result from the violent actions we engage or are complicit in.
How does it all come together? We drive fossil fuel-burning cars (direct violence) because there is no way to get from our suburban homes to work (structural violence) and since everyone does it, it’s really not too bad (cultural violence). Given these realities, we need to mine tar/oil sands, create tailings, build pipelines and ship product. And some citizens get angry when they can’t engage in economic activity that results in environmental violence, and then elect governments that promise that they will help shield our consciousness from the implications of our actions. “Voltaire put it well when he said, ‘Those who can make you believe absurdities can make you commit atrocities’” (Bandura, 2007, p. 193).
Environmental violence and environmental education
I have three approaches that educators can take with their students to confront the reality of environmental violence in all its forms: direct, structural and cultural.
We can confront environmental violence with environmental non-violence; in the domains we live, with the tools at our disposal, we can work to reduce our engagement in direct environmentally-violent actions. While we might not be able to completely “do no harm”, we all have the opportunity to do what we can and, both individually and collectively, develop a descent strategy to reduce our direct harms. My 30 km bike ride to and from work is a small act of environmental non-violence.
In our educational institutions, we can work to first identify and then reduce direct environmental violence. For example, since the transportation sector produces 24% of all GHG emissions in Canada (just behind the 26% produced by that oil and gas sector) (Environment and Climate Change Canada, 2017, p. 8), schools can look at ways to encourage low-carbon transportation. Walking, biking, skiing, skating, car-pooling, school bus and public transit are all ways of reducing the direct environmental violence of transportation associated with schooling (http://ontarioactiveschooltravel.ca/active-transportation-strategy-for-canada/) . Providing large parking lots at secondary schools for students and staff gives the wrong message if we are trying to reduce direct environmental violence; we should not be encouraging single-occupancy vehicle transportation.
Buildings and electricity combined account for nearly the same GHG emissions (23%) as transportation, so energy retrofits and building conservation efforts can help to reduce the direct violence in those schools that especially use heating oil or natural gas. For example, Destination Conservation (http://www.dcplanet.ca/index.html) is a long-running program that focuses on schools, helping them make significant reductions in their energy and water usage; DC is an exemplar in reducing the direct violence of school building operations.
When environmental educators deal with environmental issues in our schools and classrooms, we tend to focus on the outcomes of the visible forms of direct violence, and can respond with non-violent alternatives.
But at least as important, in terms of our practice, is finding ways to help reveal the cloak of invisibility that hides the structural environmental violence from our purview. Revelatory tools aren’t necessarily easy to find, and we are likely going to have to make some up ourselves. But there are some means at our disposal that can help us and our students come to a deeper understanding of why things are the way they are.
The roots of environmental violence can’t be looked for in the simple surface features of littering and pollution, but rather in the systems and structures that produce as a necessary outcome of their existence the environmental problems we are confronting. As environmental educators, we all need to gain skill and experience in systems analysis (Meadows, 2002, 2008). But it isn’t enough to simply do analysis of the structures in our institutions that result in environmental violence, we need to also look for ways of changing the structure (Meadows, 1999) of the system.
Changing structures involves politics, and this kind of pro-environmental activity is what I’ve come to call environmental anti-violence; the work we do to alter those structural features of our institutions or society that facilitate, or at least fail to stop, direct environmental violence. Students and teachers can work together to change structures, whether they are school board policies, or the actions of various levels of government. Analytical and political anti-violence work of students and teachers can involve things like working to mandate pro-environmental changes of school operations, making pro-environmental presentations to municipal governments, learning how to run for elected office, organizing boycotts and engaging in protests or civil disobedience. As the noted social psychologist Kurt Lewin said, “you cannot understand a system until you try to change it” (Schein, 1996, p. 6). Try to change a system and it reveals itself, and anti-violence work is about getting clarity as to the nature of the system.
But for many of us, students, teachers and parents alike, because of the structures of our systems, we can only do so much to reduce our direct environmental violence. And it might be difficult for us to engage in political action to change those structures creating violence. However, there is always something that we can do, and those things that we can do to try and reverse or even partially-undo our destructive acts are what I have called environmental contra-violence, actions that work to undo the actions that we are all complicit in and responsible for.
In some ways, this is the easiest and most approachable form of action in the face of environmental violence that any of us can take. Actions like recycling, cleaning up local pollution and litter, picking up refuse washed up on our beaches and shorelines, healing habitat loss, alteration and destruction through replanting and re-naturalizing, are all things that we can do. The field of ecological restoration (van Wieren, 2008) is, I feel, the work of contra-violence as its practitioners endeavour to make amends, doing in whatever small and seemingly insignificant ways they can, to undo even a tiny part of the damage are all complicit in as members of our society.
Contra-violence is the kind of work that we can and should do with our students in our communities, working to reduce our wastes (and even trying to not see them as wastes, but as resources), cleaning beaches (in what is truly a Sisyphsian task as each tide can deliver its own load of garbage!), restoring wetlands, bringing butterfly gardens into cities, creating rain gardens, anything and everything that can be contra/against the environmental violence that surrounds us all. Broadly speaking, the work of ecological restoration is a moral act and for some a spiritual act, a form of repentance, of apology, of stepping gently in and assisting natural processes in healing from our damaging actions.
We cannot put an enormous burden on the children to engage in actions that they may be unable to execute; they cannot be responsible for saving the rainforests, or protecting species in habitats far away. But perhaps most important is that as educators, we help to bring the pieces of the problem together, discerning along with our students the linkages between direct, structural and cultural violence. This process of revealing what is hidden, no matter the contexts we find ourselves in is, as I noted at the outset, one of the most important skills that we can offer. And with that revelation, we can work together and can support students and teachers working from their realities, to reduce violence through non-violent, anti- and contra-violent actions.
 Rick Kool is founder of the MA in Environmental Education and Communication at Royal Roads University in British Columbia. He has published on the walking speed of dinosaurs, Northwest coast native whaling, museum exhibit design, ciliated protozoan development and the sex life of marine invertebrates. His current work relates to environmental education and how it confronts hope and despair, the potential role and place of religion in environmental education, and conceptions of change in environmental education and communication. Kool is active within the Victoria Holocaust Remembrance and Education Society and is a past president. He also plays the string bass.
References
Arendt, H. (1970). On Violence. New York: Houghton Mifflin Harcourt Publishing Co.
Bandura, A. (2007). Impeding ecological sustainability through selective moral disengagement. International Journal of Innovation and Sustainable Development, 2(1), 8-35.
Environment and Climate Change Canada. (2017). Canadian Environmental Sustainability Indicators: Greenhouse Gas Emissions. Retrieved from Gatineau, QC: https://www.ec.gc.ca/indicateurs-indicators/default.asp?lang=En&n=FBF8455E-1.
Finkel, M. L. (2018). The impact of oil sands on the environment and health. Current Opinion in Environmental Science & Health, 3, 52-55. doi:10.1016/j.coesh.2018.05.002
Fischer, D. (2013). Johan Galtung, the Father of Peace Studies. In J. Galtung & D. Fischer (Eds.), Johan Galtung: Pioneer of Peace Research (Vol. 5). New York: Springer.
Galtung, J. (1980). A Structural Theory of Imperialism: Ten Years Later. Millennium: Journal of International Studies, 9(3).
Galtung, J. (1990). Cultural violence. Journal of Peace Research, 27(3), 291-305. Retrieved from http://www2.kobe-u.ac.jp/~alexroni/IPD%202014%20readings/IPD%202014_2/Cultural%20Violence%20(Galtung).pdf
Galtung, J., & Fischer, D. (Eds.). (2013). Johan Galtung: Pioneer of Peace Research (Vol. 5). New York: Springer.
Kahn, A. E. (1966). The tyranny of small decisions: Market failures, imperfections, and the limits of economics. Kyklos, 19(1), 23–47.
Meadows, D. H. (1999). Leverage points: Places to intervene in a system. Retrieved from Hartland, VT: http://donellameadows.org/archives/leverage-points-places-to-intervene-in-a-system/
Meadows, D. H. (2002). Dancing With Systems. Retrieved from http://www.sustainabilityinstitute.org/pubs/Dancing.html
Meadows, D. H. (2008). Thinking in systems: A primer. White River Junction, VT: Chelsea Green Publishing Company.
Schein, E. H. (1996). Kurt Lewin’s change theory in the field and in the classroom: Notes toward a model of managed learning. Reflections, 1(1), 59-74. Retrieved from http://forteza.sis.ucm.es/apto/alum0203/scheinlewin.pdf
Tainter, J. A. (1988). The Collapse of Complex Societies. Cambridge, UK: Cambridge University Press.
Turner, G. M. (2012). On the cusp of global collapse? Updated comparison of The Limits to Growth with historical data. GAiA – Ecological Perspectives for Science and Society, 21(2), 116-124.
van Wieren, G. (2008). Ecological restoration as public spiritual practice. Worldviews: Environment Culture Religion, 12(2/3), 237-254.
by editor | Mar 20, 2019 | Climate Change & Energy
A Chance to Make a Difference: Tackling Climate Change in a Middle School Classroom
by Angela Duke
Northwest Expedition Academy
Hayden, Idaho
 n the days of selfies and social media mania, it is often a difficult job getting middle schoolers to look up instead of down. When I first introduced the topic of climate change to my students, the reactions were mixed. But most importantly, several heads looked up.
Climate change in the classroom has gained great momentum and for good reason. What more real of a problem than the state of our planet? And what better a subject to let our young people tackle? The environment of the future will be theirs to live in after all. How powerful is it to empower students to solve problems that may have always seemed out of reach or “too big?” Facilitating science-based research on real world problems empowers students not only through the skills they acquire from this type of work but from the subject knowledge gained. Climate change curriculum in the classroom also allows students to see how much of a difference they can make not only on their school campus but in their larger community as well. That makes the work important. Investigating climate change, understanding human activities that contribute to climate change and formulating strategies to slow climate change down also cultivates environmental-literacy.
 At first, I was intimidated. Climate change is such a huge topic with so many different avenues and tangents to get lost in. Then I happened upon Green Ninja – the climate-action superhero. This discovery immediately took me back to my own childhood, watching episodes of Captain Planet, an environmental superhero in his own time. I was instantly intrigued. Green Ninja (www.greenninja.org) is a middle school curriculum that focuses on helping students design a more sustainable world. Each grade level (grade six through eight) consists of six units. Each unit is centered around a series of phenomena and central storyline that seamlessly blends topics together in ways that make sense. The units use elements of project-based learning to bring the content to students in engaging and entertaining ways. For example, embedded in the curriculum is access to animation and live-action videos that introduce and reinforce topics of study. My students also enjoyed playing the environmentally-themed video game which is used to hook students and get them to interact with a serious topic, the effects of human-released carbon ithen our atmosphere, in a low-stress setting. And all the while they are learning. Everybody loves a hero, as the saying goes, and Green Ninja is no exception. Green Ninja gives students access to points of change in a way that is not overwhelming. His appearance is familiar and friendly, which allows students to focus on what is being said and the main lesson to be learned from each video.
When it came to prior knowledge, my students all knew the “what” of climate change: what to do, what not to do, what was better and what was worse. The three “Rs” of “reduce, reuse, and recycle” came up a lot. What stopped them in their tracks is when I asked, “Why should we take action? Why should we reduce, recycle, and reuse? Why do people think solar is better? Why do people think it’s better to buy a hybrid or full electric vehicle?” There were lots of shoulder shrugs. Then came the answer I’m sure we’ve all heard, “because they said it was better.” The all-encompassing “they.” “They” are usually the source of most misconceptions. The majority of my students’ misconceptions revolved around the difference between weather and climate. I knew there was a whole unit in Green Ninja on that topic so when we got there, we dug in. I made sure students had time to access prior knowledge and allowed them time to journal I before each subtopic. I also frequently built in time for them to look back through and reflect on any changes in their thinking that happened. I wanted their understanding and interpretation to be natural and their own discovery.
If I had to choose one series of lessons that I believe made the strongest impact on my students, it would have to be those surrounding our carbon footprint. There are several websites, such as Green Ninja, that give free access to videos that can be used as a starting point to a unit or subtopic. In one instance, I used the Green Ninja video entitled, “Footprint Renovation.” You can see it here: greenninja.org/Green_Ninja_Show/31. In this video, an average homeowner awakens to find that his feet are swelling in size. The viewer is shown several areas in the house that could use some eco-friendly renovation. For example, the window is open and the heat is on. All of the homeowner’s electronics have been left on. There is no recycling or compost bin and the garbage is overflowing. Our superhero, Green Ninja, arrives to save the day (well, in this case, the night) and there is a direct visual correlation between the renovations being made and the decrease of swelling in the homeowner’s feet. I used this as an entry event to a new unit and followed the video with partner talk around a simple open-ended question, “What was that all about?” I remember the room bursting into conversation. Each table of students talking about what they saw, what they liked and what it could possibly mean. I had them hooked.
 Later on, in that same unit, my students collected energy-use data from their own homes over one four-week period. Then they designed an energy reduction plan for their household. After they worked with their family to implement the plan, they collected data again over another four-week collection period to measure their reduction in energy use. But I didn’t want to stop there. I wanted my students to continue climbing the environmental literacy ladder and move from awareness to knowledge to attitude to skills to collective action. I combined portions from a few different lessons from the TeachEngineering website (https://www.teachengineering.org/) to put together a research assignment where students collaboratively collected current data on factors that influence our carbon footprint, such as transportation choices, appliance choices, and food choices. I wanted to grow students’ environmental literacy and know it starts on an individual level, so I asked each student to decide on a factor that was of the most interest to them. Students were then given time to research this factor and gather as much data as they could. While they conducted their research, I used this time as a benchmark of learning and formative assessment and checked in with them, “Can you explain why you chose the factor you did? Do you understand the assignment? Do you know where to search for the data you need?”
Once our research block was over, I asked them to put themselves together into groups of four with those with the same factor. Another component of environmental literacy is to make educated decisions as a group. So here, students worked collaboratively to synthesize their individual research into one combined and complete presentation. This presentation was their first graded assessment.
 I could have stopped there. But another important component of environmental literacy is to share knowledge with others. To satisfy this, each group was asked to present their new knowledge and findings to two different audiences. Their first audience were third graders who were also learning about making good environmental choices. I used these presentations as a benchmark, and formative assessment, of their learning. Groups had to know their content well since, because of the audience’s age, my students could not just read lines of data or pages of facts. Some groups made posters and others brought in props. Still other groups wrote fictional stories with the new information embedded.
The students’ second audience was adults. Their presentation to adults had to not only contain research data and facts but also real, logical, feasible solutions to lowering carbon footprints. They were given choice as to how they would present; posters, Google slideshows, speeches with artifacts or even Powtoons (a platform to make your own digital video or presentation). This presentation was their second and final graded assessment. To ensure students knew what to expect and what they’d be graded on, I borrowed from rubrics from Buck Institute for Education (bie.org). They specialize in project-based learning. The rubrics can be daunting if you’ve never used them before but it’s easy enough to adapt them to your students and your projects.
Tackling climate change in the classroom was new to me. It was not easy. But one of my biggest tips to other educators is to remember it’s okay to try something new and not know it one hundred percent. Just as we give our students time to improve on their skills, we also need to give ourselves time to improve our skills. Sometimes that means jumping in with both feet and taking on problems as they come. Not everything is going to go right, but that’s O.K. What a learning experience it will be!
At the end of the year, we reflected on what we had accomplished. I had my students reflect individually in their science notebooks about their contributions to the project and how they felt it went overall. With their project groups, they reflected on their performance as a team, how it went and improvements they would make next time. Finally, as a whole class, we debriefed the entire experience and what was enjoyable and what was not.
Did I feel my students had an engaging experience? Absolutely! Heck, I had an engaging experience! Did my students feel they had an engaging experience? Definitely. In the end, out of the ninety students I taught that year, about twenty students demonstrated they were committed to continuing to take action to lower their carbon footprints. And while I would be lying if I didn’t say I hoped to get through to many more, I remembered to practice what I preach and take the advice I often give students, “If we each do something small, together we can do something big.” So this year it was twenty students, but next time around it might be thirty. Knowledge is contagious. Even a small number of students changing their actions and leading by example still equals a big win for the planet!
Resources (alphabetized) mentioned in the article:
Buck Institute for Education (www.bie.org): A nonprofit and leader in project-based learning. Several free resources that include collaborative work rubrics and project-planning tools can be found on their website. They also offer professional development for teachers.
Cool Climate Network, U.C. Berkeley (coolclimate.berkeley.edu/calculator): There is a carbon footprint calculator here. You can also google carbon footprint calculator and find several options. Some are more student-friendly than others.
Green Ninja (www.greenninja.org): NGSS middle school science provider and creator of many great, free videos. With Green Ninja, each unit of instruction includes phenomena, hands-on activities and projects that allow students to use science and engineering to create their own environmental solutions.
PowToon (www.powtoon.com): A digital animated presentation tool that can be used by students to create Public Service Announcements, 100-word presentations, animated cartoons and educational presentations. Great for teachers to use to flip instruction too.
National Environmental Education Foundation (NEEF): References to environmental literacy based on NEEF’s “Environmental Literacy Report 2015”: www.neefusa.org/resource/environmental-literacy-report-2015
Teaching Engineering (www.teachingengineering.org): Great collections of supplementary lessons focused on how to use engineering in the classroom.
A bout the author: Angela Duke is a fifth-grade teacher at Northwest Expedition Academy in Hayden, Idaho. She previously taught sixth grade Language Arts and Science for seven years in San Jose, California. She enjoys participating in as many outdoor activities as she can with her husband and three children. She is passionate about project-based learning and strives to give her students as many hands-on experiences as possible. Her goal every year is to develop her class’ growth mindset and take the away stigma of science being “too hard”. She enjoys developing new fun and engaging curriculum and sharing her experiences with others.
 More about Green Ninja: The goal of Green Ninja is to create environmental solutions through education. The project grew out of an NSF grant funding academic research at San Jose State University that identified key elements to support student engagement and success in science.
Green Ninja is now using this knowledge to create materials that help schools improve how they teach science, while also inspiring student agency around environmental topics. Their middle school curriculum is aligned with the Next Generation Science Standards and builds on Green Ninja videos to help inspire student engagement and success. If you are interested in learning more, go to www.greenninja.org or email info@greenninja.org.
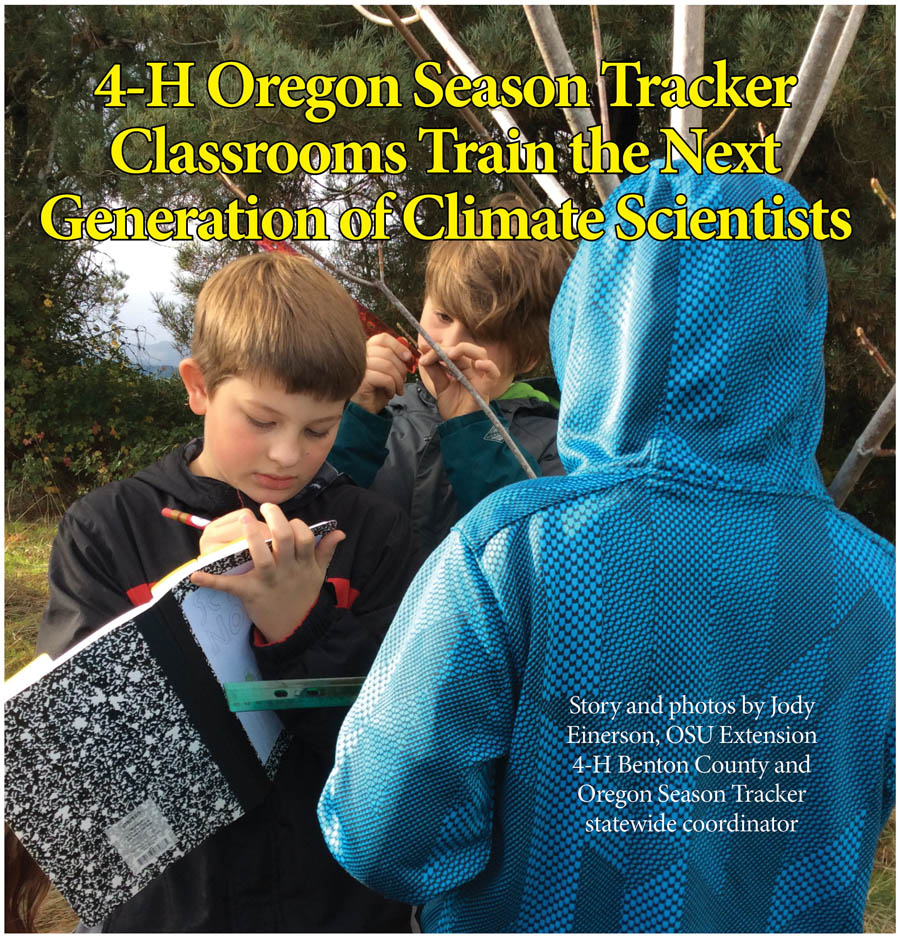
by editor | Feb 7, 2019 | Climate Change & Energy, Schoolyard Classroom
On a sunny fall day in Oregon students are outdoors learning about the new citizen science observation site in their schoolyard. With a mix of 4th and 5th grade exuberance and the seriousness of adults they are taking on the mission of gathering basic data for a section of their school yard scientific study and research area. These students are part of the Oregon Season Tracker 4-H classroom program that is regularly getting them outdoors for real world science. As the teacher explains, this is the first of many data gathering sessions as part of their yearlong commitment to the program. This real world data will support researchers to gain a better understanding of climate change across Oregon.
 regon Season Tracker (OST) 4-H classrooms are a companion to the Oregon State University Extension Oregon Season Tracker adult citizen science program http://oregonseasontracker.forestry.oregonstate.edu/ . In the adult program, volunteers are gathering and reporting their observations of precipitation and plant seasonal changes in a statewide effort. Started in 2013 and targeting adults, it quickly became evident to everyone involved that the program had clear applications to outdoor hands-on “experiential” science learning for students.
The foundation of the OST program is based on a partnership between OSU Extension and HJ Andrews Experimental Forest located in Blue River, near the midpoint of the Cascade Mountain range https://andrewsforest.oregonstate.edu/ . The Andrews is a leading center for long term research, and a member of the National Science Foundation’s Long-Term Ecological Research (LTER) Program. The 16,000 acre research forest in the McKenzie river watershed in the Cascade Mountains was established in 1948, with paired watershed studies and several long-term monitoring programs initiated soon after. Today, it is jointly managed by the US Forest Service and OSU for research into forest and stream ecosystems, and the interactions among ecological dynamics, physical processes, and forest governance.
Part of the success of the Oregon Season Tracker program is that we have also collaborated with national programs, Community Collaborative Rain Hail and Snow Network (CoCoRaHS) https://www.cocorahs.org/ and National Phenology Network (NPN) Nature’s Notebook https://www.usanpn.org/natures_notebook, as well as our local partner. A key role of our national partners is their ability to collect, manage and store the data, making it available both to professional and citizen scientists. This national connection makes sure the data is available long-term and easily accessible locally as well as nationally and beyond. Both of our national partners have easy to use web based visualization tools that allow volunteers and students to easily look at and interpret data. In the classroom this means not only are students helping ongoing professional research, they can also investigate or research their own science questions using the data of others. Partnering with these national database sites also allows OST to stretch our resources further, spending our time and energy supporting the volunteers and classrooms in our program.

Zero is important data when reading the rain gauge!
Back at the school, it is 8:30 am and a student team is checking and recording the level of precipitation for the last 24 hours. The rain gauge station is set up outside the school entrance and is clearly marked with a sign explaining what the students are doing. Parents and visitors can clearly see they are part of the Oregon Season Tracker 4-H program collecting precipitation and plant phenology data as citizen scientists. The sign calls attention to their efforts and gives the students a sense of pride in what they are doing.
Students use a program approved manual rain gauge that is standardized nationally. They become comfortable reading the gauge marked out in hundreds of an inch and how to conform to set data protocols. They learn not to round measurements for accuracy, to read using the bottom of the meniscus, and how to deal with an overflow event. All skills that have math applications for what they are doing. Depending on the grade of the students these skills are new or a refresher of what they already know, but important none the less.
Students learned the rain gauge skills at the beginning of the year in outdoor relay races using Super Soakers to simulate rainfall in their gauge. Teams vie to see who can get the most “rainfall” into their gauge. The casual observer might mistake this activity for recess, but they are having fun learning the needed math skills. By learning to read the manual gauge to .01 of an inch they are following the protocols set out by our national partner CoCoRaHS.
The daily precipitation observations are establishing a piece of the scientific process. As part of the team approach, the observations readings are verified before dumping out the day’s accumulation. Students begin to get a feel for what an inch of precipitation looks like, both as it falls from the sky and what it looks like in the gauge. The data collected is then passed on to another student team that hovers over the classroom computer, entering it in the national CoCoRaHS website. Data entered by 9:00 am is shared on an interactive map, for any visitor to the website to view.
The data submitted to the CoCoRaHS website is accessed and used by meteorologists, hydrologists, water managers, and researchers. It is also captured daily by the PRISM Climate Group, one of our local OSU partners. PRISM gathers climate observations from a wide range of monitoring networks (including CoCoRaHS), to develop short and long term weather models that are in turn used by still more groups and agencies reporting on and studying weather and climate. This is an important thing for all our adult and student observers to realize: their data is real, it is important, and it gets used.
So for those students that are worried that their data will just get lost in the mountains of reports submitted every day, I’d like to share this experience. This past year, I worked with a teacher that received an urgent email from the National Weather Service within a short time after the Monday morning rainfall report was entered in the database. The Weather Service continuously monitors for extreme weather, and were checking on the accuracy of the morning report of over 2 inches of rain. Quick sleuthing found the students had made an error in submitting their data. Instead of making a multiday report for the weekend they had made a single day report. This was an eye opening experience for the students, not only to realize their data is being used but also that scientists are depending on them to be accurate.
Monitoring a rain gauge is an easy lesson to expand or extend into other topics. Students can be challenged to look for weather patterns by comparing their own station with others across your county, state, and even the nation. Alternatively, by graphing daily data or comparing the rainfall data against topographic maps. These types of observations can challenge students to see patterns and make connections. This leads to investigating essential questions such as: how do these weather and climate patterns play out across the state and how does this effect what and who lives in these locations?
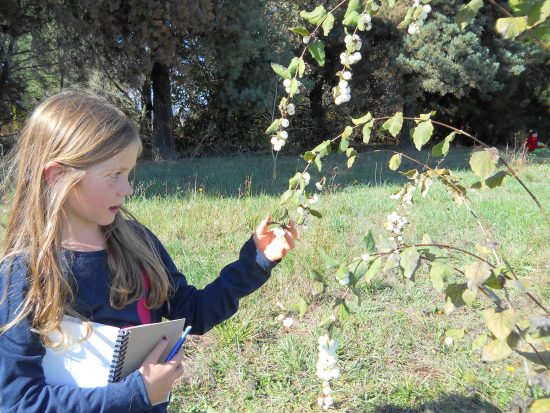
Observing fruiting on a common snowberry shrub.
OST students are also tracking plant phenology or growth phases over the year. They will be reporting on leaf out, flowering, fruiting, and leaf drop. By pairing these plant change observations with the precipitation readings, researchers have a powerful tool in the study of climate and the role it plays in plant responses. The OST program has identified eight priority native plant species that we encourage using if possible. These priority plants 1) mirror plants studied at the Andrews Forest, 2) have a large footprint across the state, and 3) are easy to identify. By targeting this small group of priority plants, we add density to the data collected making it more useful for our research partners. Our research partners at the Andrew’s Forest have many long-term studies looking at phenology and climate. They not only look at plant phenology but intensively study the ecosystem connections with watersheds, insects and birds. OST phenology data collected by students and volunteers allow the researchers to apply their findings and connections on a larger statewide scale.
Back at school, we now shadow a High School class. Students in an Urban Farm manage and work in a small farm on the school grounds, growing market vegetables and managing a small flock of egg laying hens. As part of their Urban Farm, they have planted a native pollinator buffer strip surrounding their large market garden. In this pollinator garden, they have planted vine maple, snowberry and Pacific ninebark, several of the OST priority plants, which they are observing weekly. They started their strip by studying the needs of the plants looking at soils, sunlight, and water needs. They then matched appropriate plants with their site, found a source and planted their buffer strip. Adding native plants to their buffer helps to attract and sustain the native pollinators in their garden. These students carry a field journal out to the garden and collect phenology data weekly as one of the garden jobs.
 Just like precipitation data, observing and reporting on plant phenology has a set of protocols that need to be followed to standardize the data, and ensure accuracy. OST and Nature’s Notebook (our national partner with the National Phenology Network) are looking for the timing of some distinct phenophases or plant lifecycle stages. The students concentrate on looking for leaf bud break, emerging leaves, flowers and buds, fruiting or seeds, and leaf drop. Nature’s Notebook has defined criteria for reporting each one of these stages.
We have found students as young as 3rd graders can be accurate and serious phenology scientists with a progression of training and understanding. It all starts with being a good observer, one of those important science skills. We have found one of the best tools to teach observation is to consistently use a field journal (e.g., field notebook, science journal, nature journal) when working outdoors. A field journal is a tool that helps to focus students and keep them on track, and to differentiate their outdoor learning time from free time or recess. A simple composition book works well, is inexpensive, and is sturdy enough to last through the seasons.
Start with a consistent expectation of what a field journal entry will include and help students to set this up before they go out in the field. Page prompts will help younger students focus on the task. At a minimum, all field journal entries should include the date, time, weather, and location. Depending on the focus of the day, have students include sketches, labels, and notes on colors. Have students include at least one “I wonder” question they would like to investigate and learn more about. Use the field journals as a tool to help students focus in on the plant they are observing for OST, but also encourage them to observe everything around them. This broader look is what leads students to make those ecological connections that just may spark their interest in science and lead to a lifelong study.

Phenology photo cards help with recording data.
As students get comfortable using a field journal we introduce phenology. Phenology is the study of nature’s seasonal changes, and a scientist who studies phenology is looking at the timing of those seasonal changes and the relationship to climate. Although OST focuses on plant phenology, the observational skills can apply to wildlife and insects, for example reproduction and migration. Phenology is an easy observable phenomena that can lead your science study and help meet Next Generation Science Standards http://www.nextgenscience.org/resources/phenomena .
We use a fun activity to introduce phenology and help students focus on what is happening outdoors in the natural world. Start by having students brainstorm in their field journal a list of all the things they can remember occurring outside during their birthday month. They can use plant cues, animal migrations, weather and light. For example,, “the earliest bud break has already happened, daffodils are blooming, the daylight hours become equal to the night hours, and the early bird migrants have arrived” (March). Once they have their list, pair them up with someone who does not already know their birthday. Then have them trade clues to see if they can guess each other’s birthday month. For younger students you may decide to help them with a class brainstorm and write the different nature clues on the board under headings for each month.
Once the student have a good understanding of the concept of phenology we go outside to start observing. OST has developed some handy plant phase field cards that have pictures and definitions for students to refer to and compare as we learn the phenophases in the field. Nature’s Notebook has printable data sheets that students can take out in the field to record their data. We have found that by copying these data sheets at the reduced size of 87%, they fit into the composition book field journal and can be glued in to create a long term record of data at the site.

Using technology to create an informational video.
Technology also plays a key role when doing citizen science with your students. Both Nature’s Notebook and CoCoRaHS have developed easy to use free apps. The versions work with both Apple and Android devices, so you could use them on phones and tablets as well as entering data online with classroom computers. We take it one-step further and use the tablets to document the student learning. Each student team works on creating an informational video of the project over the school year. We give them the option of creating a video to train other students or make a video to communicate their work back to our partner researchers at the Andrews Forest. This video becomes an assessment tool for teachers and is something that the students enjoy. We limit the videos to no more than a three minutes, which means they need to plan it out well. They spend some of the slower winter months creating a storyboard, writing scripts, filming and editing. A 5th grade teacher at Muddy Creek School said, “The iPads engaged my most distractible students. Also, everyone was vested in this project because of the fun the iPads bring to the table. Basically, iPads were a great motivation to learn the science.” For Apple products, you can download a free version of iMovie for creating and editing your final product. There are also free editing apps that can be used on Android devices. Here is one of our early attempts using a movie trailer format https://www.youtube.com/watch?v=1KdNPZp-1Fs
In exchange, “Researcher Mark” (Schulze) from the Andrews Forest is in a video we created for the students. Walking through the HJ Andrews Experimental Forest we visit one of the many phenology plots at the forest. Mark explains how the phenology plots are scattered across a gradient of elevations at the Andrews. This allows them to look at plant responses to weather and climate as well as delving much deeper, making connections to insects, birds, soils, drought and much, much more. Mark explains that he is gathering data on some of the very same species as the students, and looking for the same phenophases. He takes them on tour of one of the many meteorological stations at the Andrews to see the many different climate instrumentation and variables that they are studying. In the end, Mark shares how valuable their citizen science data is to the future study of climate.
So, what does the Andrews research community hope to get out of collaborating with OST citizen scientists? With the wealth of information they are amassing, they are also interested in seeing if the trends and patterns they are documenting on the Andrews hold true across the varied landscape of Oregon. There is no stream of funding that could finance this kind of massive scientific study except through tapping into the interest and help of volunteer citizen scientist including teachers and classrooms across Oregon. In this circular process of interactions between researchers and volunteers we hope to extend the conversations about climate science, and document the landscape level changes for the future.
It is easy to see how the students benefit, both by applying “real science” outdoors on a regular basis, and their career exploration as scientists. Teacher’s surveys report taking their students outdoors to work on science an additional 8 – 12 times per year because of this program. One Middle School science teacher says, “A great opportunity to get students collecting ‘real’ or authentic data. Given that the work is from a national source it also helped students take ownership of their project and feel its importance.” Students also learn and practice many of the NGSS standards and science practices working on and experiencing real world problems, not just reading about it in a text book.
Climate change is a real and sometimes overwhelming problem for many students, leaving them with a sense of helplessness. What impresses me the most with the students in the program is that they come away with a mindset of how they can have a positive impact in the field of climate science. When asked what they liked best about this program student surveys stressed that positive connection, “Helping scientists felt good.” “That I can make a difference.” “By helping researcher Mark, it was not just for fun it was real.” A good step in building the ecological thinkers and problem solvers we need for our future.
Jody Einerson is the OSU Extension 4-H Benton County and Oregon Season Tracker statewide coordinator.

 Before each field investigation, students are exposed to the pertinent disciplinary core ideas in class (National Research Council [NRC], 2011; NGSS Lead States, 2013), explore issues present at field sites, read relevant scientific articles, and learn field data collection techniques. Students then collect data in the field with support from resource professionals. After each field investigation, students analyze their data and use the results to discuss how to solve ecological issues they may have encountered. Adults guide students through this process at the beginning, with the goal that students will develop the necessary skillset to conduct independent, community-based, water-centric research projects by the end of the academic year (Figure 1). Students are ultimately challenged to creatively communicate their research projects, including both the scientific results and their proposed solutions to environmental issues encountered in their watershed, at a regional youth research conference (e.g. Youth Water Summit).
 Originally created to serve as a sustainable method to continue outreach efforts from a National Science Foundation Graduate STEM Fellows in K-12 Education (GK-12) grant (Rittenburg et al., 2015), the development of TCP coincided with the release of the Next Generation Science Standards (NGSS) (NGSS Lead States, 2013). With a strong emphasis on science and engineering practices, disciplinary core ideas, and coherent progressions (Reiser, 2013), the TCP model closely aligns with these new standards. Given that much of the curriculum developed for the older National Science Education Standards is content-focused (NRC, 1996), TCP fits the need to create curriculum that includes opportunities for students to explain how and why phenomena occur and to develop the critical thinking skills associated with scientific investigations.
 TCP curriculum aligns with several Performance Expectations and Disciplinary Core Ideas from the NGSS (Table 1), and can also easily adjust to fit within multiple courses. TCP curriculum has been incorporated into less flexible, standards-driven courses like Biology and Chemistry, as well as more flexible courses like Environmental Science, Entomology, and Earth Science. While each class participates in the same three units (water quality, water quantity, and water use), teachers tailor these units to the learning objectives of their courses.