by editor | Jun 19, 2024 | Critical Thinking, Environmental Literacy, Experiential Learning, Features on Outstanding Programs, Marine/Aquatic Education, Outdoor education and Outdoor School, Outstanding Programs in EE, Place-based Education, Teaching Science
How to Design Field-based Research Experiences
By Molly L. Sultany, msultany@nwacademy.org
High School Teacher, Northwest Academy, Portland, Oregon
Navigating Unchartered Waters
How can educators help students feel more connected to the outdoors while engaging with the work of research scientists? Scientific research may feel elusive to high school students, an unknown world hidden behind a technical paper, a puzzling chi-square analysis, or a p-value waiting to be deciphered. Yet, participating in field-based research may improve students’ intrinsic motivation, build resiliency, and enhance their sense of personal agency and responsibility (Marley et. al, 2022). I believe that teaching students outdoors introduces novelty and authentic learning opportunities into an existing science curriculum (Behrendt & Franklin, 2014). In addition, field-based research experiences provide a compelling alternative to a digitally dominated learning environment, often inundated with electronic media. Benefits to students’ well-being may include a longer attention span, multi-sensory experiences, deeper context for learning, a sense of comradery and feelings of community belonging, as well as reduced stress and fewer signs of ADHD (Grimshaw et. al, 2016). Overall, introducing a fieldwork component to existing curriculum may enhance student engagement, improve critical thinking, and foster positive interpersonal skills.

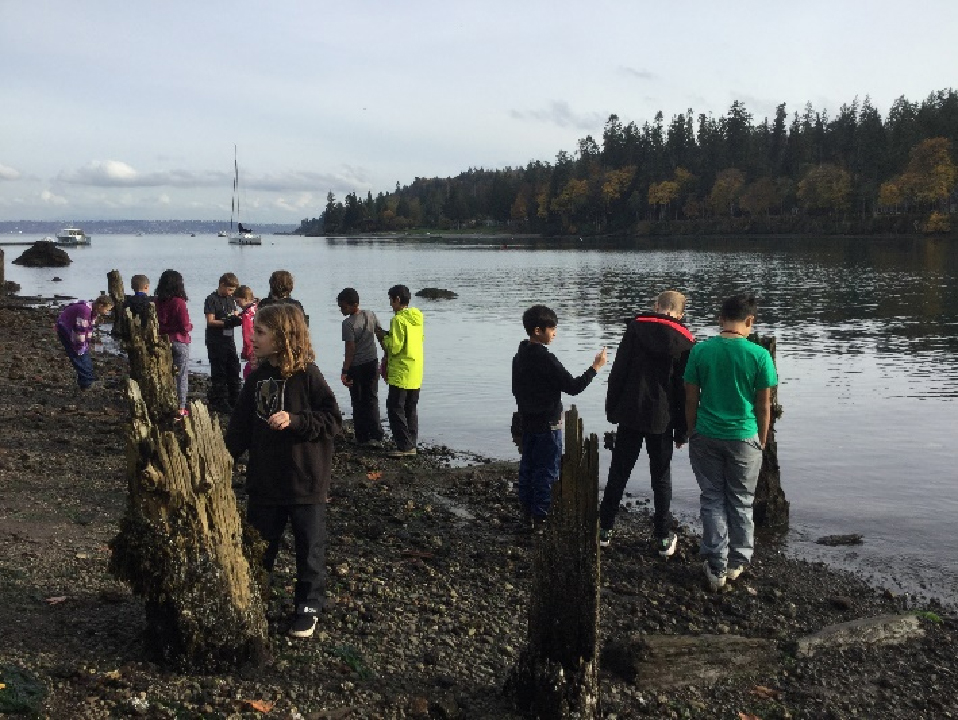
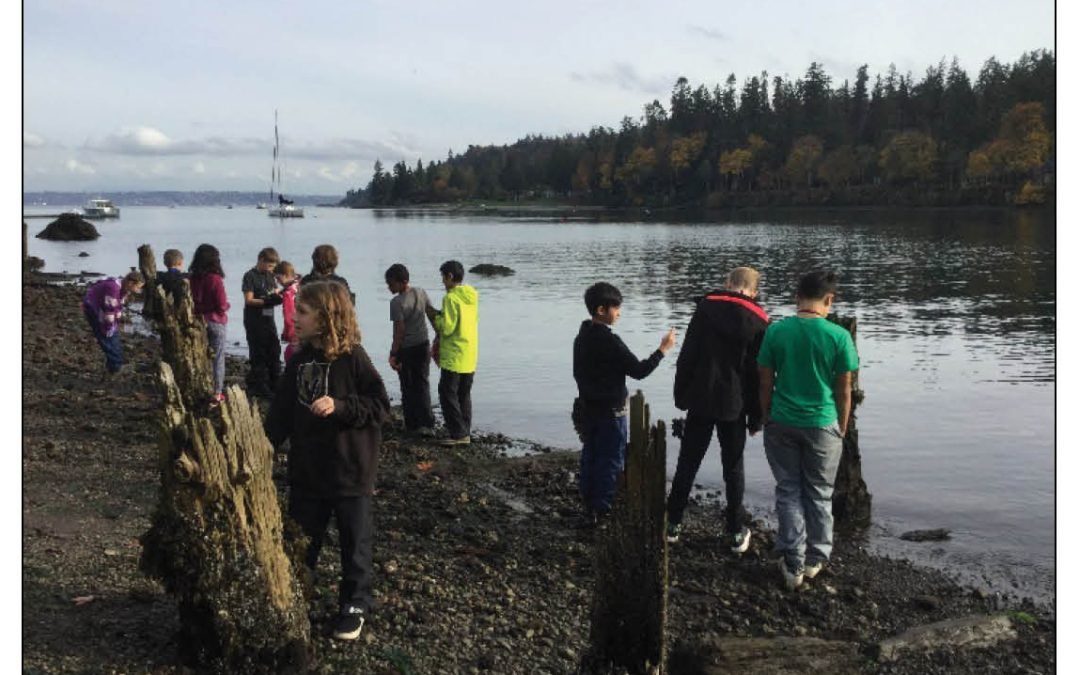
At our field site in Cannon Beach, Ofregon, students measured 3,807 ochre sea stars with 54 total search hours.
How to Engage Students in Field-based Research Projects?
· Build Your Professional Network: Connect with other educators at your school, district, or area interested in developing student-led research projects. Attend professional development opportunities for science education.
· Partner with Local Non-Profit Organizations: Become a member of regional and national non-profit groups dedicated to environmental conservation. This may provide opportunities for volunteering where you can meet like-minded individuals and build lasting community connections to enhance your understanding of local environmental issues.
· Lead with Student Interests: Brainstorm ideas for research projects with students. Start with a field trip to a nearby park, green space, or natural habitat. Find ways to discuss local conservation issues as part of your curriculum. Be inspired by students’ own personal interests, curiosity, and inquiry.
· Create a Science Lunch & Learn Program: Invite STEM professionals from your school community or region to give a presentation during the lunch hour for students about science career pathways, current research, or ways to become involved with the larger scientific community.
· Video Chat with a Scientist: Get inspired by programs offered through NASA, NOAA, and the Nautilus Live: Ocean Exploration Trust to connect students virtually to scientists to learn more about their research.

Wearing hip waders and waterproof gloves, Northwest Academy students measured ochre sea star (Pisaster ochraceus) size classes, and observed signs of sea star wasting syndrome.
Local Spotlight: Diack Ecology Education Program
After attending an Oregon Science Teachers’ Association (OSTA) meeting, I learned about the inspiring work of the Diack Ecology Education Program. This unique program provides Oregon educators with financial support and pedagogical resources through grants, workshops, and programming. Their goal is to provide guidance for teachers to develop effective student-centered, field-based science inquiry experiences. I admire the program’s values: commitment to local stewardship, opportunities for student leadership and decision-making, and an emphasis on outdoor experiential learning. Through their website (https://www.diackecology.org/), teachers can apply to attend bi-annual workshops taught by experienced science educators, where they learn how to construct a science inquiry project centered on local field work. The Diack program strives to help teachers develop greater scientific literacy and build civic engagement on themes related to local ecology, natural history, and environmental science.
Over the past ten years, the Diack Ecology Education Program has funded multiple student research projects at Northwest Academy, an independent high school in Portland, Oregon. Participation in this program has connected my high school students to the larger scientific community, including The Johnson Creek Watershed Council, Portland State University, U.S. Stockholm Junior Water Prize Conference, and the Oregon Environmental Science Summit where students had the opportunity to present their research in person to Dr. Jane Goodall. These experiences have transformed our high school science research program, and introduced students to the wonder, joy, and complexity of the natural world. Past projects have included a study of local stream health (2014), the role of diatoms as indicators of water quality (2015), and microplastics in beach sand (2017). Our most recent project (2022) had a dual focus on how marine biota respond to environmental change by studying the prevalence of sea-star wasting syndrome in ochre sea stars (Pisaster ochraceus) and documenting nesting success of cormorants during the summer breeding season.
 Benefits to Students
After our field research at the Oregon Coast in 2022, I learned that participating in field research has many direct benefits to adolescents, with transformative effects on socio-emotional learning, scientific literacy, and the development of a civic identity. By taking part in challenging field tasks in an unpredictable outdoor environment, students may develop an improved positive self-concept and increased self-esteem, seeing themselves as capable learners. One of my students reflected: “I learned that I have much more patience that I give myself credit for, and that I am also good at paying attention to details when I am observing.” In addition to these changes in self-perception, I believe there is value in helping students see science in action beyond textbook learning. This may, in turn, deepen students’ respect for the natural world. The student leader of our field team shared: “I learned about the shocking effects of sea star wasting syndrome, and what this damage for the sea star population could mean for the rocky intertidal ecosystem. With little prior knowledge of the effects of climate change or any practical interactions with climate change, seeing the effects of sea star wasting syndrome on the sea stars was immediately eye-opening.”
Lastly, participating in a science project with relevance to a region may strengthen students’ civic identity and build meaningful connections with their local community. It may also help students cultivate a personal connection with the natural world. While exploring the tidepools, each field day brought novel discoveries, keen observations, and many more scientific questions. By the end of our project, my students had become fiercely protective of our beach field site, which hosted incredibly diverse rocky intertidal habitat home to invertebrates, from crabs to chitons. One of my students shared: “walking through the sea cave at the tidepools and seeing all the biodiversity, from sea stars to isopods, was my favorite part of fieldwork. I want people to treat the world around us with respect. Interacting with the public and teaching them about this small part of marine conservation was meaningful and important to me.” This newfound sense of stewardship for the natural world was accompanied by their desire to teach others, share what they had learned, and reinforce proper tidepool etiquette at the beach.
Fostering Teacher Professional Learning Goals
Immersing students in dynamic environmental field research may also benefit educators in terms of curriculum design, pedagogy, and improved content knowledge. Inspired by field experiences with my students, I decided to incorporate themes related to marine biodiversity, ocean conservation, and anthropogenic global climate change into my high school science classes. Fieldwork reinforced the value of fostering creative and critical thinking with a flexible mindset in my approach to science teaching. It emphasized an inquiry model of the scientific method, fostering science process skills from observation to questioning. For many students who participated in fieldwork, this experience led to other opportunities to share their research findings at local science fairs, conferences, and school events. All in all, I believe that participating in field-based research projects will remain a valued tradition for our science program at Northwest Academy.
Acknowledgments
A special thank you to Mike Weddle, from the Diack Ecology Education Program, & Jesse Jones, CoastWatch Program Manager.
Works Cited
• Behrendt M & Franklin T. A review of research on school field trips and their value in education. International Journal of Environmental & Science Education. 2014 9 (10).
• Grimshaw M, Curwen L, Morgan J, Shallcross N, Franklin S, Shallcross D. The benefits of outdoor learning on science teaching. Journal of Emergent Science 2019, 16 (40).
• Marley SA, Siani A, Sims S. Real-life research projects improve student engagement and provide reliable data for academics. Ecol Evol. 2022, 8 (12).
by editor | May 27, 2022 | Marine/Aquatic Education
There’s a song in the sea for those who listen, and messages in the sand for those with far reaching eyes.
By Dr. Gloria Snively and Doug Wonnacott
 The morning silently creeps in upon the gray, green waves. Smooth flat rocks that tumbled together for a thousand years moan and groan against the shore. The pale sea is without character of its own — it reflects the sky, follow the moon, and is driven by the wind. On the rocks high above the tide land, the gulls preen their feathers and wait for the tide to drop
Eventually the unmerciful tide ebbs, exposing soggy, wet seaweed covered rocks. The moaning cobbles crowding the beach are littered with the debris of life. Along the tide land that marks the ebbing and flowing of the tide, death walks hugely and in many forms. Among the debris are empty snail shells, torn pieces of golden sponge, tattered seaweed holdfasts, decaying crab molts, and nude hermit crabs fumbling for a new home. The tangled masses of up-rooted seaweeds: browns, greens, reds and purples lie strewn like shredded confetti. Shore crabs scramble sideways to hide under rocks, starfish hang with stretched tube feet from boulders, and barnacles withdraw into cone-shaped shell houses. An octopus with glaring yellow eyes lies stranded in a shallow pool of water with its long suction-cup covered arms thrashing in vain to return the victim to the mother sea.
The gulls that earlier sat half asleep on the rocks noisily pick and probe at crabs, worms and fish along the tide line using their long sharp bills. Opportunists, they squabble and fight and harass one another to regurgitate their finds. The hungry gulls scavenge over the wreckage of the beach to clean it of whatever they can find; the living, the dead and the dying. The vulnerable sea creatures cry soundlessly for life — and nothing screams but the gulls.
During such times, on the ebb of tide, I have observed another swarm of vulturine activity. Upon the morn’s fog-blanketed shore, electric flashlights bob along like fireflies to join the gulls. This is the sign of the clam diggers. They stumb‑le along in the fog, over-turning cobbles, digging mercilessly with long handled forks and shovels, and leaving piles of cobbles beside gaping holes in the sand. Tens of hundreds have passed by me, many leading wide-eyed children with wooden spades and plastic pails. Butter clams, horse clams and littlenecks are gathered into overflowing buckets, the smallest and the largest tossed aside. Mothers and children gather into pails brightly colored starfish. They collect bags of beautifully ornamented living shells whose occupants will be carted home and dried in the sun, boiled alive for their shells, or left to suffocate in buckets overnight. Eventually, the unsleeping tide follows the moon and drives both gulls and humans from the tide land.
On one such occasion, I carefully picked my way along a slippery boulder strewn beach. Ahead of me the humans with long wooden spades amused themselves by smashing barnacles with rocks. I hastened through the seaweed jungle, past the slippery cobble stones, to the barnacle bed above the high tide line.
“Don’t harm the barnacles,” I ventured breathlessly. “Please leave them alone.”
The humans pretended not to hear, and continued smashing the barnacle cities.
The barnacles are alive,” I pleaded.
“What?” replied the surprised humans. “Barnacles aren’t alive.”
“The barnacles are very much alive. They simply retreat into their shell houses when the tide is out.”
“You’re crazy,” laughed the humans.
“But you mustn’t kills the barnacles,” I persisted. “They follow the rise and fall of the tide and the revolutions of the moon.”
“Who cares?” came the angry rebuff. “What does it matter, there are millions of these things everywhere.”
And they continued smashing the barnacle cities, prying loose the mussel beds with those long wooden spades, and filling their pockets with beautiful living shells.
I turned and slowly began the treacherous journey back along the slippery beach. Who invented those spades of wood? Who was it that cut them from a tree? High overhead a snow-white gull circled the bay, a large blue mussel dangling from its bill. The gull let the mussel drop to smash the shell open on the hard cobbles, exposing the orange colored flesh. Instantly, the other gulls filled the air with their chorus of frenzied screams. Void of pity, I watched that snow white gull swoop down, rip the soft orange flesh from the mussel shell, and hurriedly fly away.
The tide rises, the tide falls. The mother sea follows the moon. The mob of cobbles crawled the shore; rubbing shoulders — shifting, grinding and moaning their way through centuries. I stroll along the tide line and ponder the many moods of the mother sea; wondering why she moans ever more. “We are not dumb,” whisper the cobbles. “We will be the last ones.”
Song of the Barnacles
I venture to say, though a teacher myself, that I have learned little of consequence from books or from any other extra paraphernalia that we associate with formal education. What I have learned that has meaning or significance in life comes not from books, but from an endless journey along a surf-swept shore.
If there is any truth to what I say, it began for me on the protected rocky shores of Ucluelet, a little village on the exposed western coast of Vancouver Island, British Columbia. As an elementary teacher, that memorable trip to the sea beach with a class of wide-eyed youngsters was among the first of many such adventures to unknown shores.
 It was one of those magnificent sunny days in June, the kind that we on the west coast appreciate deeply after the cold grey days of a long winter. The trip to the beach was a fifteen-minute hike along a wooded trail from the local school.. On the outer shore the view was spectacular. The roaring sea rhythmically sent booming white waves crashing upon the rocky reef. But in the cove, protected by the reef and the bay, the wave action was less fierce. Sleeping haystack rocks and needle-shaped basalt boulders crowded the graceful curvature of the bay.
On the shore, the tide was going out, leaving glistening seaweed covered rocks and glassy blue pools of water in holes and crevices. Various belts of life appeared on the rock faces in colored layers, one above the other. Bare rock at the top, then a stained layer of black lichens, a wide band of gray-white barnacle cities, a bed of blue mussels, then bright green sea lettuce, a layer of luxuriant brown kelp, then graceful pale, pink coralline seaweed at the low tide line. Attached to rocks, among the protective curtains of seaweeds, and in the tide pools lived hoards of rocky shore animals.
Many so exquisitely colored and of such fantastic shapes they seemed unreal — orange starfish, purple urchins, giant green anemones, richly ornamented snails and variously decorated crabs.
As we explored the shore, I could hardly keep pace with the activities of the children. Nor could I answer their incessant questions: What’s inside a barnacle? How does the starfish eat the mussel? Why do crabs crawl sideways? Why is the ocean blue? What’s that called? Is that a plant or an animal? Those children, who asked me so many questions, never seemed to hear the ones I asked them. Nonetheless, I did the best I could — carted tons of field guides down to the beach, hauled out microscopes, and had them describe, measure, sort, map and sketch everything in sight.
Several days later, around mid-day, we returned to that very same beach. The intense noon-day sun cast drying rays upon every living creature along the shore. And we humans were no exception. Hot and sticky from our journey and having to wait for the noontide to drop, we sought protection in the shade of those high basalt pillars. We settled down to a bag-lunch of bologna sandwiches and apples and — being full and tired — decided to nap while waiting for the tide to go out. Like the nearby gulls lazily preening their features, we waited patiently for the sea to allow us entry into the tide lands.
It was one of those rare moments in teaching when every child was quiet, every body still. Thus, you can imagine our surprise at being awakened by the sound of gently resonating voices.
They whispered “sssssssh…” Carried by the wind, those tiny, tiny voices grew and grew into a soft, melodious symphony.
One by one, astonished children and a very unbelieving adult rose, and with eyes and ears staring out of our heads, we began searching for the source. Where did those mysterious little voices ring from? We looked all around where we stood, then searched the boulder canyons, but to our great disappointment, we could not find a single clue. All the while those tiny melodic voices continued echoing with magnificent simplicity throughout the canyon walls.
Suddenly, from behind a giant boulder, a very excited Scott shouted, “It’s the barnacles! It’s the barnacles singing!”
“Awe… come on. How could the barnacles sing?” quipped the skeptical Mark. “They don’t even move.”
“But listen!” persisted Scott. “Listen to them sing!”
So we put our ears to the barnacle cities and what do you think…?
We clearly heard the barnacles sing.
Imagine…barnacles singing! It was the most remarkable sound I believe I have ever heard.
“What makes the barnacles sing?” asked one child.

Crystal Cove Conservancy
“What do you think they’re saying?” added anotherOur curiosities aroused, we instantly set about the find the answers. With intense concentration, we observed those barnacle cities for the rest of the day. Watched the six-cover plates move as the animal inside sealed its shell house shut. “Sssssh.” Watched the seawater evaporate over the boulders and over every living surface. Listened intently as the barnacle song swelled to a crescendo, then just as magically as the seawater vanished, listened as the music faded to silence. Later that day, when the tide returned, we watched those barnacle cities spring to life. Quick as a wink, when the stony cone-shaped barnacle cities spring to life. Quick as a wink, when the stony cone-shaped barnacles were submerged, the barnacles thrust their six long feather legs, like a fisherman’s net, in and out, in and out. We watched those industrious little barnacles sweep the water for microscopic food and kick it down into their mouths. You can be sure we were an exhausted, but jolly band that tripped back to Ucluelet late that afternoon. But we had whistled and sung to the moon and stars, and vowed to remember that lesson.
That lesson was the loveliest and the saddest I have yet learned along an unknown shore. How many times had I walked along a seashore and never noticed the barnacles, never pondered or questioned them at all? But I have drawn this true story to your attention, so that should you venture along a rocky shore and come upon the barnacle cities, do not hurry on. Wait for a time, exactly at the ebb of tide. And be very quiet and still. Then, should the sun be burning bright, you will hear the barnacles sing.
At the time of publishing, Gloria Snively was a professor emeritus at the University of Victoria in Victoria BC. Doug Wonnocott was a principal at Quadra Island Elementary School in Quadra Island BC. This article originally appeared in Current, the publication of the National Marine Educators Association
_____________________________________________________________
Activities related to this article
The purpose of the following activities is to encourage the reader to interact with the article through the language arts (reading, writing, listening and speaking); and through field trip experiences; and to use the knowledge, concepts and attitudes developed through the activities to compare the article with the real world of the barnacle. Above all else, the activities are designed to keep bringing the reader back to the article, to not only gain knowledge, concepts, and positive attitudes; but to experience the author’s style and message.
Some Thoughts About the Language Arts Activities:
1. Be selective in choosing the activities. Decide what you want the reader to gain from the literature. Don’t overdo the activities and don’t hesitate to adjust them to meet your needs.
2. Consider using cooperative learning techniques, including the use of heterogeneous groups (3-5 members). The use of these groups encourages discussion, sharing of skills, peer-to-peer tutoring and expansion of ideas.
3. If you are using the article as motivation for a science-oriented theme, don’t leave it after one reading. Bring the readers back to the text, especially after they have gained new knowledge, concepts and attitudes.
Pre-Reading Activities
1. In order to evaluate the student’s knowledge, do a pre- and post-reading cluster. Before reading the article have the students cluster (brainstorm) all they know about barnacles. Following the teaching of the unit, have the students do another cluster. Compare the pre- and post-results.
2. To encourage the sharing of prior knowledge and to encourage the making of predictions about the meaning of what is to be read, use an anticipation guide. An anticipation guide helps guide the students in acquiring the major concepts to be learned in the article. It activities background knowledge prior to reading and provides useful, diagnostic information for the teacher. Also, it provides students with a purpose for reading the text, provokes thoughtful discussion, and serves as a useful tool for refocusing on the major concepts of the article. Keep the following guidelines in mind when constructing and using an anticipation guide:
-
-
a. Identify the major concepts to be learned.
b. Decide how many concepts support or challenge the student’s beliefs.
c. Create 5-10 statements. Write them well and somewhat conentiously.
d. Arrange the statements in an appropriate order.
e. Present the guide to the students before introducing the article.
f. Students fill in individually, agree or disagree, a reaction to each statement.
g. Students defend their reactions in discussion. Teacher leads the discussion, but does not volunteer a personal opinion.
h. After reading the article, students react to statements from the author’s point of view.
i. Discuss differences in reaction.
j. Writing: choose one statement and then prove the author’s point.
e.g.,
You Author
(agree/can’t decide/disagree)
• Barnacles are living animals.
ª Barnacles are very delicate creatures and may be easily damaged.
• Barnacles are important members of a seashore community.
• Clam diggers should not be allowed to take as many clams as they want.
• Barnacles sing.
3. Use guided imagery to help develop the setting of the article prior to the reading. Through imagery the teacher can take the students on an “imaginary trip” to the beach. By generating discussion about colors, sounds, textures, sights, patterns, feelings, etc., the teacher can help the students connect when they “see” to what they will read.
Reading and Writing Activities
4. Consider orally reading the article to the students, especially Part 1. Help to set the mood and the flow of the language — then allow the students to read the rest.
5. Encourage the students to identify their favorite passages and to orally read to each other in pairs or small group. By practicing reading passages over and over again until fluent within these groups, weaker students may improve their reading comprehension.
6. From the article, have the students identify those factors that help the barnacles survive in its environment. Once they have their lists, allow the students to refer to additional learning resources to confirm their lists and to add to them.
7. Again, use the guided imagery strategy to help the students write a piece from the point of view of the barnacle. The piece may focus on one aspect of the life of the barnacle — feeding, survival, the effect of human intervention, etc., and should be creative, while conveying factual information. Students may share these pieces in small group.
8. Write a true story telling about life at the seashore: what barnacles eat, what they do at high tide and at low tide (or when covered or uncovered with seawater), how they protect themselves from predators, how they keep from drying out when the tide goes out to sea.
9. From the article, have the students identify the author’s writing style and message. For example, in small groups discuss the statement “That lesson was the loveliest and the saddest I haveyet learned along an unknown shore.”
10. Have students complete each of these ideas with material growing out of the article and discussion. This article made me wish that…, realize that…, describe that…, wonder about…, see that…, believe that…, feel that…, and hope that… (Good for small cooperative groups to generate discussion and expand on ideas.
11. Design a poster which celebrates our caring for all life on this watery planet, and inspires action, leading to the healing of our planet and ourselves. For example, a poster might encourage “prevention of cruelty to barnacles.”
Field Trip Activities
For students to understand the concept of preservation at the seashore, they must have understanding, at least in part, of the related concepts of habitat, tidal cycle, desiccation, predator-prey, protection, interdependence and survival. The best way of attempting to sensitize children to such complex abstract concepts is through field trip experiences. For example, you can lead the students to understand why barnacles should be protected by observing how barnacles survive at the seashore.
Have the students separate and find a comfortable sitting position as close to the “barnacle cities” as possible. Have them close their eyes and be very quiest and still. Tell them to concentrate on hearing and identifying the sounds around them.
Then, have fun watching live acorn barnacles under water. Find a small rock covered with barnacles and drop it into a jar of seawater. What happens? What kid of food does the barnacle eat? How does the barnacle get its food? Draw a picture of a barnacle out of seawater. Draw a picture of a barnacle under seawater.
After the field trip, compare the article to the reality of the field trip. Have students identify those aspects of the article that are true for the environment being studied. Include specific aspects that could be added to the article given the specific environment.
-
—G.S and D.W.
by editor | Jun 18, 2021 | Features on Outstanding Programs, Marine/Aquatic Education, Outstanding Programs in EE, Place-based Education, STEM
A Year in the Watershed
There is no doubt that if you want to get students truly excited about what they are learning, ask them to tackle a real-world question or problem — ask them to solve something that is relevant to their lives.
by Jean M. Wallace

It is no surprise that children learn best by doing. And, when they seamlessly integrate across subjects and spend ample time working to find solutions to real problems that will improve lives, fulfill needs, and make our world a better place, their learning reaches a much deeper level. During my 20 years in a leadership role in experiential education, establishing partnerships and supporting hundreds of teachers and thousands of students in authentic learning, I witnessed this success first hand. There is also no doubt that if you want to get students truly excited about what they are learning, ask them to tackle a real-world question or problem — ask them to solve something that is relevant to their lives. In using this approach, students come to realize that what they are doing in school really does have meaning.
Whether describing this learning process with terminology such as STEM, STEAM, Project-Based Learning, Problem-Based Learning, or EIC (Environment as an Integrating Context — the process used by my former team as outlined below), it is the alignment of the content (the “what”) and the process (the “how”) that drives these successful learning models. Integration is critical, as it is the bonding of content and process that strengthens the structure of learning for students. Rather than teach in isolation, teachers and schools should model the 21st century skills we want our students to acquire by collaborating, cooperating, and communicating across disciplines to make learning more meaningful in all subjects. The effectiveness of using the environment as the foundation for interdisciplinary learning is not new to education and is supported by research.
Founded in 1995, the State Environment and Education Roundtable (SEER) worked with 16 state departments of education to develop Environment-Based Education (EBE) as a standards-based instructional strategy to engage students in “real-world” learning experiences. Over 40 schools took part in this national study, which resulted in the 1998 publication of Closing the Achievement Gap: Using the Environment as an Integrating Context for Learning (Lieberman & Hoody, 1998). As was the case with the national EIC research study, our own EIC program was extremely successful and proven to close the achievement gap.
 Environment = Authentic Learning
Moving from teaching in isolation to teaching across disciplines can be challenging, but my firm belief was (and still is) that a powerful and deep understanding of content coupled with a meaningful and authentic process of student engagement results in deeper learning for children.
Therefore, when building an curriculum focused on authentic learning, it made perfect sense to use Pennsylvania Environment & Ecology (E&E) Standards as a foundation on which to build an integrated and student-centered curriculum: one that would shape the framework for active, authentic, community-based science teaching and learning. Along with cross-curricular, real-world, rigorous content, an E&E-based program offers students the opportunity to engage in service learning and civic action, creating responsible and caring global citizens. This is evidenced in the introduction to the E&E standards, which reads as follows:
“Environment and Ecology is grounded in the complexity of the world we live in and our impact on its sustainability. The human interactions with the ecosystem and the results of human decisions are the main components of this academic area. Environment and Ecology examines the world with respect to the economic, cultural, political, and social structure as well as natural processes and systems. This integration across systems is what sets this academic area apart from all others.” (Pennsylvania Department of Education, 2001)
Starting in Kindergarten, content outlined in the E&E standards also became the foundation for literacy acquisition and was used to generate enthusiasm in our youngest readers. As they were learning how to read, they were connecting what they were reading to the real world around them. The content outlined in these standards formulated a rich vocabulary upon which students could build as they progressed through the curriculum. One example that comes to mind is the topic of Agriculture, which was introduced in Kindergarten and then reinforced in 3rd grade in a multi-disciplinary, multi-week unit of study. Classroom libraries were stocked with vocabulary-rich books, and learning was enriched by field studies to area farms, nature centers, streams, rivers, and museums.
The June 2014 Progress of Education Reform Report issued by the Education Commission of the States, reaffirms the success of applying this early science literacy approach in an authentic learning environment: “Science interactions support vocabulary development by exposing children to new words in meaningful context. Exposure to rich vocabulary words predicts vocabulary development, which predicts reading achievement.” The importance of early science literacy acquisition is summed up nicely in this same publication: “Education leaders should turn a critical eye on the science teaching and learning expected for early education in their school, district or state, then determine whether there is any evidence that children and their teachers are receiving the instructional opportunities they need and deserve.”
 Creating the EIC Curriculum
But how and where do you begin when creating an integrated curriculum? For our team, utilizing the E&E standards for content; the interdisciplinary, student-centered process of the EIC Model; a strong emphasis on 21st century skills; and backwards mapping became the perfect collective starting point. Our guide was Dr. Patricia Vathis of the Pennsylvania Department of Education, who is an expert in standards, interdisciplinary learning, and Understanding by Design. As a K–8 team, we began the curriculum-building process by going through each E&E standard statement and unpacking and understanding its content. After completing this, we moved on to Science and Technology, and then to Social Studies, which included History, Geography, and Civics and Government. We identified the content that “anchored” each standard statement and how each grade would be responsible for either introducing that content (I), reinforcing it (R), or bringing the content to proficiency (P).
As we were completing each matrix and assigning a color code to each grade, we were also looking for opportunities to connect content across disciplines to create big ideas for comprehensive, interdisciplinary units of study. Once our team completed a matrix for each of the content area standards, time was allocated for teachers to meet and plan with their grade level partners and teachers from different grade levels and disciplines. Everyone worked from the matrices they, themselves, created. Schedules were designed so that team-teaching could occur several times each week, allowing teachers to see and hear how each overarching topic was being presented through the lens of another discipline.
 EIC in Middle School
In some ways, the 5–8 team had a more difficult challenge than the K–4 team, since our middle school students in 5–8 rotated through different teachers and subjects. The teachers effectively met this challenge by working together to design units of study that spanned several months, with each content area well represented. For example, one unit was titled “Disease and its Impact on Philadelphia,” and was taught over a three-month period. In Science class, students investigated how vector species transmit diseases, while in Language Arts the students were reading the book Fever by Laurie Halse Anderson (2000), a historical fiction novel documenting the 1793 yellow fever epidemic that plagued Philadelphia. In Social Studies, the students were mapping out historic Philadelphia and reading and writing about a time in local history when this epidemic took many lives. In Technology, students created their own newspaper and documented the impact of the disease outbreak by writing obituaries and providing information to their imaginary community. Finally, in Art, students designed a 2-D protist from which they created a 3-D model. As students were learning across disciplines, teachers were actively teaching across disciplines. Amazing!
 EIC in Elementary School
Just one example of authentic, interdisciplinary learning that was so successful during my years in school leadership was “A Watershed Year,” when each year our 4th grade students were immersed in a year-long, interdisciplinary study of the Delaware River Watershed. Students were challenged to answer the overarching question: Where does your drinking water come from and where does your wastewater go? They began by investigating the history, geography, geology, science, chemistry, and ecology of our local freshwater streams and the surrounding watershed. During their downstream journey, students interacted with experts in local history, drafted a “Water Bill of Rights,” debated ecology versus economy, conducted field studies with the Philadelphia Water Department, mapped out their local watershed, and learned from the Army Corp of Engineers how to effectively engineer a dam.
Students also documented their journey and presented their findings to various audiences. Utilizing digital technology, they even created an interactive, informational walking tour for visitors along the trails at the local historical society. The students’ Watershed Year ended with an exploration of the Delaware Estuary and Atlantic Ocean ecosystems where they discovered the ecological diversity of aquatic life in these brackish and saltwater environments. Their final real-life adventure in learning was a three-hour voyage aboard a trawling vessel out of Cape May, New Jersey where they cast nets into the ocean and hauled in their catch, while working side-by-side with a team of marine ecologists.
 Ongoing Improvements and Growth
Professional development for teachers was meaningful, focused, and ongoing. In-service days during the school year were dedicated to curriculum development, and each summer our teachers would attend the Pennsylvania Governor’s Institute for Environment and Ecology. This Institute offered a week-long, residential learning experience that took place both indoors and outdoors. Enhancing the knowledge and skills of teachers through deep-rooted learning experiences inspired our teachers to become even better at creating and implementing authentic learning experiences for their students.
While standards dictated “what” would be taught, the process of learning was designed and reinforced by our teachers. They used content — E&E standards-based content — and the EIC practices to drive instruction. These experiences not only resulted in strong academic achievement, but they ensured outcomes of global citizenship through student empowerment and environmental civic action. Our K–8 EIC framework became the solid academic foundation on which we grew our program from 150 students to over 700 allowing us the financial and community support to build a 20 million dollar school and campus designed for outdoor learning. An amazing accomplishment that many said could never be done!
Positive Impacts
In the end, our state standardized test scores reflected the success of our EIC Model and its interdisciplinary framework. More importantly, these scores represented how immersing students in deep-dive, long-term, interdisciplinary research projects can be a successful approach for all students. As just one example, 90%–96% of our 4th Grade students achieved, on average, the highest level in the Pennsylvania System of School Assessment (PSSA) Science test. Our special education students and historically underperforming students thrived in this atmosphere of real-world, interdisciplinary learning. Our school was rated as a top performing school locally and state-wide, and ranked internationally with schools in Finland.
Throughout my years working with an incredible team, our EIC curriculum continued to evolve and was revised by our teachers. Success was contagious! Teachers were motivated and students were energized as we immersed ourselves in the study of the environment. We came to realize that doing meaningful work in an authentic environment to conserve our basic needs — the water we drink, the air we breathe, and the food we eat — was a bond that we shared and something that is relevant to us all.
___________________________
 Jean Wallace was the CEO of the award-winning Green Woods Charter School, a K–8 public charter school in Philadelphia, PA. During her tenure as CEO, Green Woods was recognized locally, regionally, nationally, and internationally for its innovative approach to learning as well as its academic achievement. She is now consulting for schools and organizations who want to take learning outside.
Prior to her work at Green Woods, Jean served as the regional Director of Education for Earth Force, Inc. (www.earthforce.org). As the Director of Education for Earth Force, Jean supported hundreds of teachers and thousands of students in service learning and civic action projects focusing on local and regional environmental issues.
Education is a second career for Jean. As a parent, Jean was an active volunteer in her daughter’s private school setting and came to recognize the vast differences between some public and private school learning environments. She sought out a second career in education to offer public school students authentic, real-world learning opportunities similar to those her own daughter experienced.
This article is dedicated with gratitude to Dr. Patricia Vathis, retired Environment and Ecology Coordinator for the PA Department of Education, and the incredible teachers and staff who made the impossible, possible.
References
Anderson, Laurie Halse. (2000). Fever, 1793. New York, NY: Simon & Schuster Books for Young Readers.
Education Commission of the States (June, 2014). Progress Report for Education 18 (2). Denver, CO: ECS.
Lieberman, G., & Hoody, L. (1998). Closing the achievement gap. State Education and Environment Roundtable Report. Poway, CA: Science Wizards.
Pennsylvania Department of Education (2001). Introduction to the Pennsylvania academic Standards for environment and ecology. Retrieval from URL www.education.pa.gov
by editor | Jan 15, 2019 | IslandWood, Marine/Aquatic Education

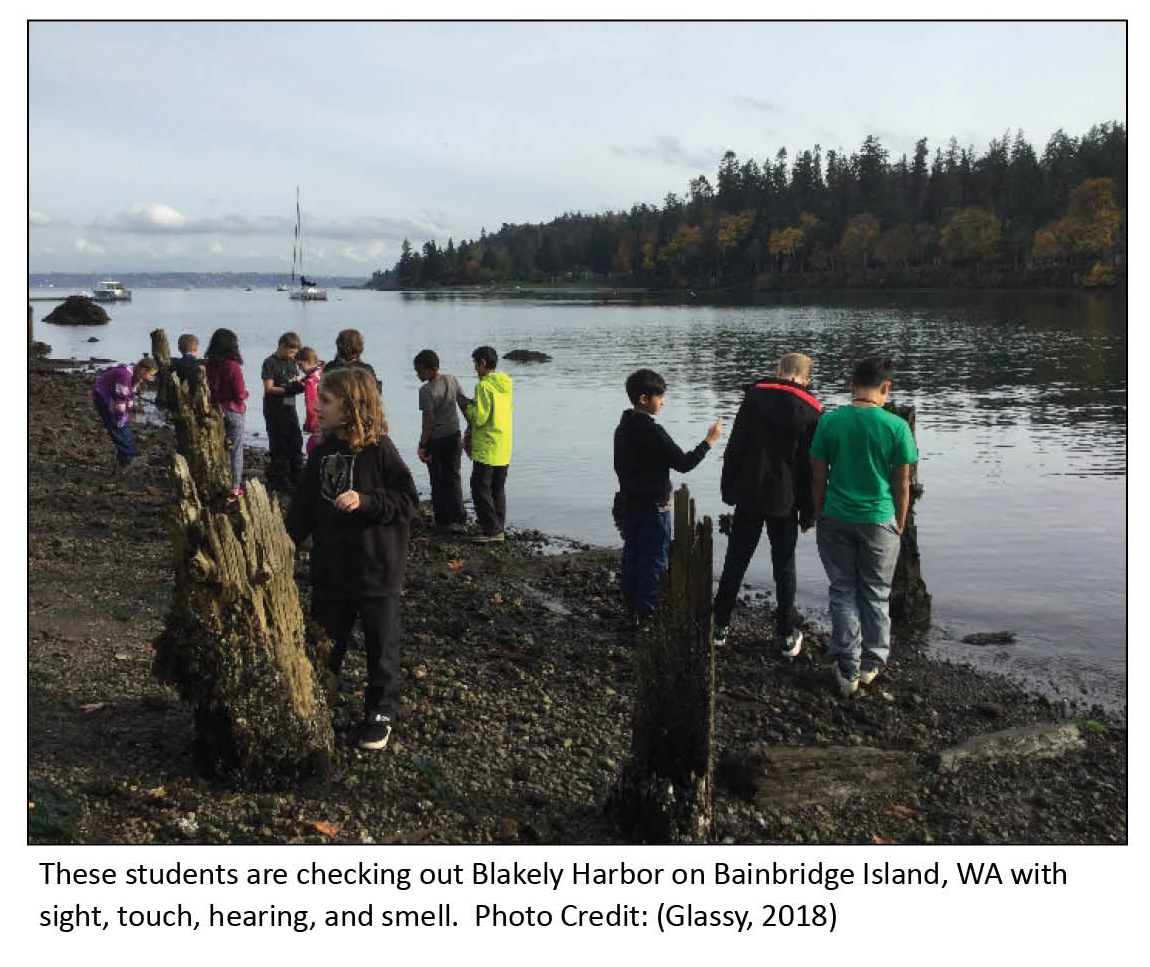
These students are checking out Blakely Harbor on Bainbridge Island, WA with sight, touch, hearing, and smell. Photo credit: Glassy, 2018
Adventure Hike to a Harbor:
Creating a space for all to engage with marine science
By Julia Glassy
I am currently a graduate student of University of Washington over on Bainbridge Island, WA at IslandWood, a non-profit outdoor education center. I am passionate about adventuring outdoors and marine science education. Interacting with the marine ecosystem allows people of all ages to explore a new ecosystem and grow an appreciation for all that ecosystem provides to the plants and animals who live there and for us, as humans.
What exactly is an adventure hike?
To some it may be walking somewhere with style or awe inspiring activities on the way to a location. While for others it may be getting in a car and driving to a location to check it out and explore. Lastly, an adventure hike could be riding a bus to go out and explore an outdoor space. To me, it is all of the above!
What might one do on adventure hike?
This all depends on the mode of transportation to a waterfront or shoreline and the age of the members going. Games you can play include wind storm (everyone needs to find a tree to hold onto or someone else if they are connected to a tree). Also flash flood (where everyone has to be on higher ground then the caller of the flood). Another game is “I-Spy” where you say “I spy with my little eye something that is blank” and you can fill in the blank. Talking as a group work too!
If in a car, then look out the window and take in the nature outside. Play a couple rounds of “I Spy” with all members in the car.
If on a bus, do what Ms. Frizzle does and make the adventure unique and exciting. Ms. Frizzle is a fictional charismatic 4th grade science teacher who takes her students on unique out-of-this-world field trips via her magic school bus.
Public transportation is an eco-friendly option to get to places that are a little farther away where walking is not an option. Also buses bring people together from all backgrounds, ages, cultures, and economic statuses. Taking a bus might not always be the most direct option, but it sure is the most fun as seen by Ms. Frizzle. It is okay to let the inner child out during these adventure hikes and explore in a new way. Aim for getting to the point of being comfortable with saying “We are on another one of Ms. Frizzle’s crazy class trips!” (Cole, 1995, p. 18). Take ownership over the adventure and be like Ms. Frizzle or like her students.
If visiting a shoreline is not feasible
Visiting your local aquarium:
They will have marine organisms that you can check out up close or hands-on. This hands-on experience is important for children of all ages in order to learn and understand similarities and differences among a variety of ecosystems.
Even if you do not have access locally to a marine or fresh water ecosystem that is okay! Books and films are good resources for learning more about an unfamiliar ecosystem. Reference books and documentaries can be purchased online or in store, but many of them can be checked out at your local library.
Getting more out of a visit to the shoreline
Get familiar with shore and ocean creatures and be a part of an investigation with children or adults you take to the harbor as an adventure hike or school field trip. Investigations do not follow the strict procedure of experiments, but instead are informal ways of wondering and discovering something. An investigation can be done in multiple ways, by taking in observations through sight, hearing, touch, or smell, and making guesses, and asking questions. Taking in observations through the different senses allows someone to become familiar with and gain a sense of place. With this new information, you can gain an appreciation for the place or item that was investigated.
Some books to refer to while familiarizing oneself with shore or ocean habitat depending on age are:
Toddlers:
On the Beach (Smith and Howell, 2003)
Young Readers and Explorers:
In One Tidepool: Crabs, Snails, and Salty Tails (Fredericks, 2002)
Magic School Bus On the Ocean Floor (Cole, 1995)
Ocean (MacQuitty, 2000)
Seashore (Parker, 2000)
Shoreline (Taylor, 1993)
All Ages-Reference:
Beachcombers Guide to Seashore Life in the Pacific Northwest (Sept, 1999)
Activities to do at a Harbor, Shoreline, or Beach
Free Exploration:
Free explorations are where someone takes a few minutes or longer of unstructured time to wander or explore a new space or ecosystem. This unstructured time can reduce all aged students’ distraction level and setup for other activities by allowing students to self-direct their investigations and learning. This is important because it allows students, children, and adults to build confidence, independence, and a greater understanding about the world around them.

Students at IslandWood’s School Overnight Program searching for crabs at Blakely Harbor on Bainbridge Island WA. Photo credit: Glassy, 2018
Crab-itat:
Crab-itats are a fun, hands-on way to explore and learn the important components that crabs need to survive and thrive. One way to make a crab-itat is to use natural materials from the beach you are on to make a habitat for the crabs found there (IslandWood Education Wiki, 2018). The logistics of this project are up to the person making the habitat, and the habitat could take many forms, and be made with several different natural items. Young students and adults can try to add abiotic (non-living) and biotic (living) items to their habitat and then think and describe their reasoning behind the items they chose.
This process of thinking and then explaining the habitat they created allows for the connection to the survival needs of crabs. You can then relate this learning to any animal or plant in other ecosystems. Another important take away from this activity is for someone to gain a sense of place and appreciation for the beach environment. With this new appreciation the person will feel more inclined to take small steps or community action to help take care of the ecosystem so others can enjoy it too!
Investigation:
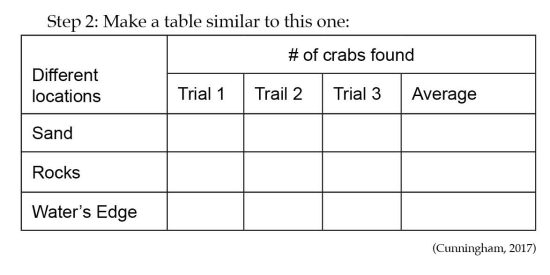
Step 1: Pick three different locations on the shoreline (ex: sand, rocks, and water’s edge).
Step 2: Make a table similar to this one:
|
Different
locations |
# of crabs found |
| Trial 1 |
Trail 2 |
Trial 3 |
Average |
| Sand |
|
|
|
|
| Rocks |
|
|
|
|
| Water’s Edge |
|
|
|
|
(Cunningham, 2017)
Step 3: Count the number of crabs at each location. The number of trials is up to you.
Step 4: Calculate average of each location, if you have more than one trial. The average will give an area that crabs are more likely to be, providing evidence for a potential claim. Through this investigation, you can gain knowledge of the preferred habitat of the crabs in your area, make observations, form claims with evidence, and be like a scientist. Investigations are important because you can make them relatable or personal to you and then gain skills that you can use at school, work, or other aspects of your life. You can also look for and investigate sea stars, sea anemones, or snails depending on your personal interests and the beach location near you.
Finding something new to learn more about:
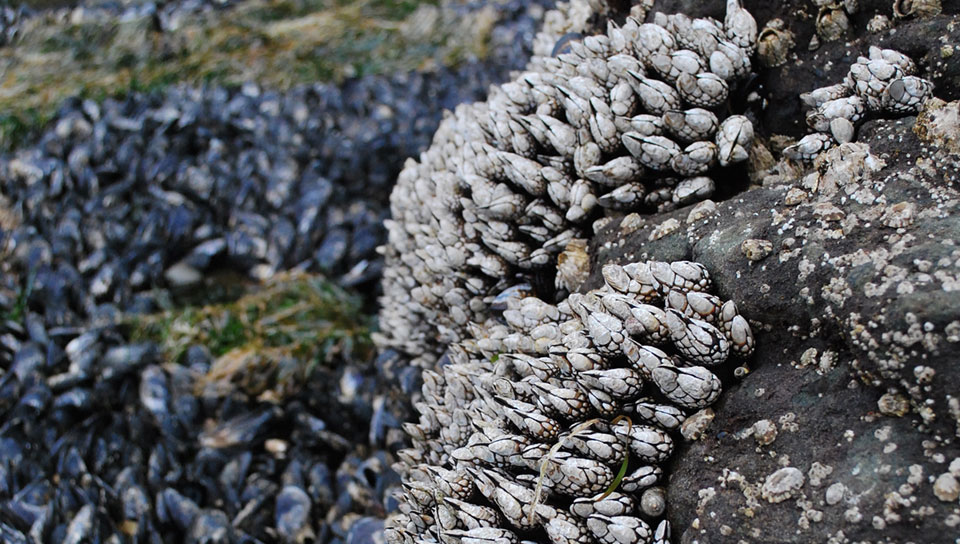
This is similar to free exploration, but instead each person or pair can find something they are interested in and use different tools to explore and learn about it. This includes using a Lummi Loupe (a domed magnifier), small containers, magnifying glasses, and/or reference books. For example, a group of fifth graders I was teaching were excited to go to Blakely Harbor on Bainbridge Island so I brought some small clear containers and some Lummi Loupes to the harbor. Some students were excited about barnacles so we picked up a rock with living, but closed up barnacles on it and put it in one of the containers with saltwater. While still at the beach we observed the barnacles in the container. Also the students used the Lummi Loupes to look at the barnacles up close. We then returned the rock to where we found it and put the saltwater back in Puget Sound. Using the different tools to learn something about the organisms through the use of the four senses (sight, smell, hear, and touch) and then referring to a guide to find out the name of the plant or animal allows for more comprehensive learning and understanding.
Common Animals and Plants Found At the Shoreline
Crabs: Shield-Backed Kelp Crab, Purple Shore Crab, many types of Hermit Crabs (Sept, 1999)
Sea Star: Leather Star, Pacific Blood Star, Purple Star, and many others (Sept, 1999)
Sea Anemones: Giant Green Anemone, Plumose Sea Anemone (Sept, 1999)
Barnacles: Thatched Barnacle, Acorn Barnacle, Goose Barnacle (Sept 1999)
Limpets: Rough Keyhole Limpet, Ribbed Limpet, and more (Sept, 1999)
Chitons: Gumboot Chiton, Woody Chiton, Cooper’s Chiton, and more (Sept, 1999)
Plants On or Near the Shore: Common Sea Lettuce, Bull Kelp, Iridescent Seaweed (Sept, 1999), and Pickleweed
Guidelines for Exploring At the Beach
- Gently roll a rock over to see what is underneath and then return to original state. The rock should be no bigger than the size of your head.
- Be cautious of picking up animals higher than your knee (that is a long way to fall)
- Have a blast exploring the beach and enjoy discovering and learning about something new
 Julia Glassy is a current graduate student of University of Washington over on Bainbridge Island, WA at IslandWood. In addition to taking classes, she teaches 3rd through 6th graders who come over to IslandWood from their schools in the greater Seattle and Bainbridge Island area for four days as a part of the School Overnight Program.
References:
Cole, J. (1995). The Magic School Bus On the Ocean Floor. Littleton, MA: Sundance.
Cunningham, Jenny. (Ed.). (2017). IslandWood Field Journal. Bainbridge Island, WA: IslandWood.
Ecosystem in a Box. (n.d.). Retrieved December 6, 2018, from https://wiki.islandwood.org/index.php?title=Ecosytem_in_a_Box
Glassy, Julia. (Photograph). (2018). Blakely Harbor, Bainbridge Island. Bainbridge Island, WA: IslandWood.
Fredericks, A. D. (2002). In One Tidepool: Crabs, Snails, and Salty Tails. Nevada City, CA: Dawn Publications.
MacQuitty, M., Dr. (2000). Ocean. New York: Dorling Kindersley.
Parker, S. (2000). Seashore. New York: Dorling Kindersley.
Sept, J. D. (1999). The Beachcombers Guide to Seashore Life in the Pacific Northwest. Madeira Park, BC: Harbour Pub.
Smith, A., & Howell, L. (2003). On the Beach. Tulsa, OK: EDC Publishing.
Taylor, B. (1993). Shoreline. London: Dorling Kindersley.
by editor | Dec 17, 2018 | IslandWood, Marine/Aquatic Education, Place-based Education
Adventure Hike to a Harbor:
Creating a space for all to engage with marine science
By Julia Glassy
I am currently a graduate student of University of Washington over on Bainbridge Island, WA at IslandWood, a non-profit outdoor education center. I am passionate about adventuring outdoors and marine science education. Interacting with the marine ecosystem allows people of all ages to explore a new ecosystem and grow an appreciation for all that ecosystem provides to the plants and animals who live there and for us, as humans.
What exactly is an adventure hike?
To some it may be walking somewhere with style or awe inspiring activities on the way to a location. While for others it may be getting in a car and driving to a location to check it out and explore. Lastly, an adventure hike could be riding a bus to go out and explore an outdoor space. To me, it is all of the above!
What might one do on an adventure hike?
This all depends on the mode of transportation to a waterfront or shoreline and the age of the members going. Games you can play include wind storm (everyone needs to find a tree to hold onto or someone else if they are connected to a tree). Also flash flood (where everyone has to be on higher ground then the caller of the flood). Another game is “I-Spy” where you say “I spy with my little eye something that is blank” and you can fill in the blank. Talking as a group work too!
If in a car, then look out the window and take in the nature outside. Play a couple rounds of “I Spy” with all members in the car
If on a bus, do what Ms. Frizzle does and make the adventure unique and exciting. Ms. Frizzle is a fictional charismatic 4th grade science teacher who takes her students on unique out-of-this-world field trips via her magic school bus
Public transportation is an eco-friendly option to get to places that are a little farther away where walking is not an option. Also buses bring people together from all backgrounds, ages, cultures, and economic statuses. Taking a bus might not always be the most direct option, but it sure is the most fun as seen by Ms. Frizzle. It is okay to let the inner child out during these adventure hikes and explore in a new way. Aim for getting to the point of being comfortable with saying “We are on another one of Ms. Frizzle’s crazy class trips!” (Cole, 1995, p. 18). Take ownership over the adventure and be like Ms. Frizzle or like her students.
If visiting a shoreline is not feasible
Visiting your local aquarium:
They will have marine organisms that you can check out up close or hands-on. This hands-on experience is important for children of all ages in order to learn and understand similarities and differences among a variety of ecosystems.
Even if you do not have access locally to a marine or fresh water ecosystem that is okay! Books and films are good resources for learning more about an unfamiliar ecosystem. Reference books and documentaries can be purchased online or in store, but many of them can be checked out at your local library.
 Getting more out of a visit to the shoreline
Get familiar with shore and ocean creatures and be a part of an investigation with children or adults you take to the harbor as an adventure hike or school field trip. Investigations do not follow the strict procedure of experiments, but instead are informal ways of wondering and discovering something. An investigation can be done in multiple ways, by taking in observations through sight, hearing, touch, or smell, and making guesses, and asking questions. Taking in observations through the different senses allows someone to become familiar with and gain a sense of place. With this new information, you can gain an appreciation for the place or item that was investigated.
Some books to refer to while familiarizing oneself with shore or ocean habitat depending on age are:
Toddlers:
On the Beach (Smith and Howell, 2003)
Young Readers and Explorers:
In One Tidepool: Crabs, Snails, and Salty Tails (Fredericks, 2002)
Magic School Bus On the Ocean Floor (Cole, 1995)
Ocean (MacQuitty, 2000)
Seashore (Parker, 2000)
Shoreline (Taylor, 1993)
All Ages-Reference:
Beachcombers Guide to Seashore Life in the Pacific Northwest (Sept, 1999)
Activities to do at a Harbor, Shoreline, or Beach
Free Exploration
Free explorations are where someone takes a few minutes or longer of unstructured time to wander or explore a new space or ecosystem. This unstructured time can reduce all aged students’ distraction level and setup for other activities by allowing students to self-direct their investigations and learning. This is important because it allows students, children, and adults to build confidence, independence, and a greater understanding about the world around them.
Crabitat
Crab-itats are a fun, hands-on way to explore and learn the important components that crabs need to survive and thrive. One way to make a crab-itat is to use natural materials from the beach you are on to make a habitat for the crabs found there (IslandWood Education Wiki, 2018). The logistics of this project are up to the person making the habitat, and the habitat could take many forms, and be made with several different natural items. Young students and adults can try to add abiotic (non-living) and biotic (living) items to their habitat and then think and describe their reasoning behind the items they chose.
This process of thinking and then explaining the habitat they created allows for the connection to the survival needs of crabs. You can then relate this learning to any animal or plant in other ecosystems. Another important take away from this activity is for someone to gain a sense of place and appreciation for the beach environment. With this new appreciation the person will feel more inclined to take small steps or community action to help take care of the ecosystem so others can enjoy it too!
Investigation
 Step 1: Pick three different locations on the shoreline (ex: sand, rocks, and water’s edge).
Step 2: Make a table similar to this one
(Cunningham, 2017)
Step 3: Count the number of crabs at each location. The number of trials is up to you.
Step 4: Calculate average of each location, if you have more than one trial. The average will give an area that crabs are more likely to be, providing evidence for a potential claim. Through this investigation, you can gain knowledge of the preferred habitat of the crabs in your area, make observations, form claims with evidence, and be like a scientist. Investigations are important because you can make them relatable or personal to you and then gain skills that you can use at school, work, or other aspects of your life. You can also look for and investigate sea stars, sea anemones, or snails depending on your personal interests and the beach location near you.
Finding something new to learn more about
This is similar to free exploration, but instead each person or pair can find something they are interested in and use different tools to explore and learn about it. This includes using a Lummi Loupe (a domed magnifier), small containers, magnifying glasses, and/or reference books. For example, a group of fifth graders I was teaching were excited to go to Blakely Harbor on Bainbridge Island so I brought some small clear containers and some Lummi Loupes to the harbor. Some students were excited about barnacles so we picked up a rock with living, but closed up barnacles on it and put it in one of the containers with saltwater. While still at the beach we observed the barnacles in the container. Also the students used the Lummi Loupes to look at the barnacles up close. We then returned the rock to where we found it and put the saltwater back in Puget Sound. Using the different tools to learn something about the organisms through the use of the four senses (sight, smell, hear, and touch) and then referring to a guide to find out the name of the plant or animal allows for more comprehensive learning and understanding.
Common Animals and Plants Found At the Shoreline
Crabs: Shield-Backed Kelp Crab, Purple Shore Crab, many types of Hermit Crabs (Sept, 1999)
Sea Star: Leather Star, Pacific Blood Star, Purple Star, and many others (Sept, 1999)
Sea Anemones: Giant Green Anemone, Plumose Sea Anemone (Sept, 1999)
Barnacles: Thatched Barnacle, Acorn Barnacle, Goose Barnacle (Sept 1999)
Limpets: Rough Keyhole Limpet, Ribbed Limpet, and more (Sept, 1999)
Chitons: Gumboot Chiton, Woody Chiton, Cooper’s Chiton, and more (Sept, 1999)
Plants On or Near the Shore: Common Sea Lettuce, Bull Kelp, Iridescent Seaweed (Sept, 1999), and Pickleweed
Guidelines for Exploring at the Beach
- Gently roll a rock over to see what is underneath and then return to original state. The rock should be no bigger than the size of your head.
- Be cautious of picking up animals higher than your knee (that is a long way to fall)
- Have a blast exploring the beach and enjoy discovering and learning about something new
 Julia Glassy is a current graduate student of University of Washington over on Bainbridge Island, WA at IslandWood. In addition to taking classes, she teaches 3rd through 6th graders who come over to IslandWood from their schools in the greater Seattle and Bainbridge Island area for four days as a part of the School Overnight Program.
References
Cole, J. (1995). The Magic School Bus On the Ocean Floor. Littleton, MA: Sundance.
Cunningham, Jenny. (Ed.). (2017). IslandWood Field Journal. Bainbridge Island, WA: IslandWood.
Ecosystem in a Box. (n.d.). Retrieved December 6, 2018, from https://wiki.islandwood.org/index.php?title=Ecosytem_in_a_Box
Glassy, Julia. (Photograph). (2018). Blakely Harbor, Bainbridge Island. Bainbridge Island, WA: IslandWood.
Fredericks, A. D. (2002). In One Tidepool: Crabs, Snails, and Salty Tails. Nevada City, CA: Dawn Publications.
MacQuitty, M., Dr. (2000). Ocean. New York: Dorling Kindersley.
Parker, S. (2000). Seashore. New York: Dorling Kindersley.
Sept, J. D. (1999). The Beachcombers Guide to Seashore Life in the Pacific Northwest. Madeira Park, BC: Harbour Pub.
Smith, A., & Howell, L. (2003). On the Beach. Tulsa, OK: EDC Publishing.
Taylor, B. (1993). Shoreline. London: Dorling Kindersley.

by editor | Oct 16, 2018 | Marine/Aquatic Education
Getting to the HeART of Teaching Marine Conservation
by Kerry Hynes

“I don’t understand. This is too hard. Why are we learning this?” These are just a few of the phrases that I hear in my classroom that force me to stop, take a deep breath, and remind myself that, yes, I am going to get through this lesson. As a teacher in 2018, I know that I’m not alone in feeling this way.
Every single day, educators take on the task of fostering students’ learning and increasing achievement in a variety of venues. And guaranteed, as a teacher, every single day you will come across challenges that make that task even more difficult than it already is. Limited resources, varied abilities, language barriers, and disinterest are a few elements that can deter every effort that you have to teach a strong lesson. It can be tiresome, frustrating, and downright exasperating when it seems as if there is no success in sight.
Engagement and Conservation
When I was assigned to teach a conservation and sustainability themed course this year to elementary school students, I was plagued with the thought of how I would be able to make the content accessible for all of my students, especially when they had never been exposed in depth to these topics. From experience, I have noted that many students associate negative attitudes with science, which makes sense due to the abstract nature and complex content of the subject [i]. Effective learners also need projects that advance their feelings of aptitude, permits them to form connections with others, gives them a sense of self-sufficiency, and advances prospects for creativity and self-expression [ii]. In turn, this can allow for greater engagement, thus creating a student who will display enthusiasm, effort, commitment to the task, and concentration. It is vital to guarantee lesson resources that relate to students’ lives and emphasize ways education can be practical.
Specifically, with regards to science, conservation-based programs have shown that participating adolescents are able to develop more moralistic attitudes toward the environment and increase positive lifestyle changes [iii]. I had the virtuous voice inside my head reminding me just how meaningful this sort of course could be in helping my students develop those environmentally sensitive attitudes, a growth that could be beneficial in leading them to understand their important role as stakeholders in conservation efforts. So not only did the content need to be accessible, but students had to become engaged with what they were learning in order for it to be applicable and produce tangible benefits to society. No pressure.
Now the question arose. How was I supposed to take this increasingly important material and transfer it to not only the minds, but hearts, of kids, many of whom were English language learners and students with disabilities? They have as much of a right and obligation to become global and environmental citizens. But how do you do that despite these challenges?
The Case for Art and Science
For me, success came with the incorporation of art. I developed lessons that In order to further develop a sense of success and allow students opportunities to work in ways in which they find their strengths, nontraditional forms of teaching have begun to emerge in the classroom as ways to engage. Multi-modal studies, which include art, allow students to engage with the curriculum in a different way so that they can examine and make meaning through all types of mediums, including graffiti, pictures, music, and gestures [iv]. Art can be a supplementary tool to teaching conservation, in that it allows individuals to become engaged with visual representations that are not as overwhelming in the sense of requiring an extensive amount of background knowledge.
Since emotions also play an integral role in our actions and everyday deeds, the arts present a way for people to form an emotional attachment and help reach new audiences and can play a positive role in changing behaviors that affect the environment [v]. Mediums such as the visual arts, poetry and music offer a vehicle to address the public not only on important issues, but in a way in which it can connect to emotions, beliefs, and attitudes [vi]. Presenting facts alone is less likely to produce a long term outcome that changes behaviors and outlook on issues [vii], whereas the incorporation of arts can lead to the long-term retention of retaining of the content long-term as well as a method to motivate innovation [viii]. Especially with students who don’t speak English as their first language, or need alternative pathways to comprehend information, visuals communicate in a way that words cannot.
 Teaching Marine Conservation
When it came to teaching a unit on the threats surrounding marine life, I decided to try to use art as one of the main mediums for conveying information. Despite living in an urban setting, there are many marine species that live or migrate through the our waters surrounding the city. Threats such as beach litter, loose fishing constraints, oil leaks, and improper disposal have been cited as some of the main causes of marine pollution and litter [ix]. With marine pollution being increasingly associated with decreasing aquatic populations, it is imperative that action and knowledge is increased to save these species.
Being that my school is in an urban setting, many students didn’t realize the variety of animals that were directly being impacted by marine litter and pollution only a few miles away. However,since many visit local beaches during the summer, as many are visitors at local beaches, I wanted them to understand the connection that they each have to the issues of marine litter and pollution. Many tend to bring many items with them such as coolers, food and beverage, and blankets, which are disposed or left at the end of their visit on the sand away from trash receptacles. Any amount of garbage and litter that is left on the public beaches is detrimental to the wildlife when left to be blown away or very, very slowly break down. There are many negative effects of this apathy for the natural world, some of which include disease, suffocation, infection, and ingestion of plastics and other types of litter, as well as entanglement in various packaging and disposed netting [x].
In order to teach about this topic, I formed educational centers that students were able to rotate to throughout the lesson, each with a different set of resources that focused on various subcategories of marine conservation. These centers used various art forms as the main methods of communication. For example, political and nonpolitical cartoons were displayed to illuminate the effects of oil leaks on habitat and seabirds. Paintings depicting the ocean with tons of man made debris floating around taught about the physical litter that winds up in the water, as well as the threats of entanglement, and ingestion. Songs and performance art pieces were also shown to educate my students about the dangers to biodiversity and vast effects that our actions can have on the environment.
After students learned about threats to marine life, their task was to create a work of art that would educate the public on the issues of marine pollution or explain ways in which they could assist in conservation efforts. Since many of my students are able to access information more readily (both in terms of engagement and understanding) through artwork, I decided to have them communicate the knowledge that they acquired to others through some of the same mediums. Their task was to create a work of art that would educate the public on the issues of marine pollution and litter or explain ways in which they could assist in conservation efforts. Since that technique was effective in engaging students, I figured that others who weren’t inclined to go out on their own to research marine conservation could learn through similar, appealing methods. And you know what? It worked.
It seems as though art can bring out the heart in science.
 Kerry Hynes is a STEAM educator in an elementary school and assists in running a Makers Lab which focuses on sustainability and conservation. She is a graduate of Manhattan College and is receiving a Masters degree in biology from Miami University in conjunction with Project Dragonfly and the Wildlife Conservation Society.
References
[i.] Osborne, J., Simon, S., & Collins, S. (2003). Attitudes towards science: A review of the literature and its implications, International Journal of Science Education, 25:9, 1049-1079, DOI: 10.1080/0950069032000032199
[ii] Kostons, D., Van Gog, T., & Paas, F. (2010). Self-assessment and task selection in learner-controlled instruction: differences between effective and ineffective learners. Computers & Education, 54, 932e940. doi:10.1016/ j.compedu.2009.09.025.
[iii] Jacobson, S. K., Mcduff, M. D., & Monroe, M. C. (2007). Promoting Conservation through the Arts: Outreach for Hearts and Minds. Conservation Biology, 21(1), 7-10. doi:10.1111/j.1523-1739.2006.00596.x
[iv] Cable, T., and T. Ernst. (2003). Interpreting rightly in a left-brain world. Legacy 14:27–
29.
[v] Brown, A. G. (2003). Visualization as a common design language: Connecting art and
science. Automation in Construction. 12(6), 703-713.
[vi] Jacobson, S. K. (2009). Communication skills for conservation professionals. Second edition. Island Press, Washington, D.C.,
USA.
[vii] Inoa, R., Weltsek, G., Tabone, C. (2014). A study on the relationship between theater
arts and Student Literacy and Mathematics Achievement. Journal for Learning
Through the Arts. (1).
[viii] Gurnon, D., J. Voss-Andreae, and J. Stanley. (2013). Integrating art and science in undergraduate education. PLoS Biology 11(2).
[ix] Zettler, E.R., Mincer, T.J., Amaral-Zettler, L.A. (2013). Life in the “Plastisphere”: Microbial Communities on Plastic Marine Debris. Environmental Science and Technology, 47 (13): 7137-7146.
[x] Kraus, G., & Diekmann, R. (2017). Impact of Fishing Activities on Marine Life. Handbook on Marine Environment Protection, 79-96. doi:10.1007/978-3-319-60156-4_4