
by editor | Sep 4, 2025 | Conservation & Sustainability, Environmental Literacy, Equity and Inclusion, Gardening, Farming, Food, & Permaculture, Indigenous Peoples & Traditional Ecological Knowledge, Place-based Education, STEM, Sustainability, Tribes & Traditional Ecological Knowledge
A Teaching Toolkit Connecting Students with Plants, Places, and Cultural Traditions
By Kim Gaffi, Mariana Harvey (Yakama) and Elise Krohn
 Educating younger generations on the gifts of the land has always been a cornerstone of Indigenous teachings to strengthen mind, body, and spirit. As Skokomish Elder Bruce Miller said, “The Forest was once our Walmart.” The Pacific Northwest is teeming with wild edible berries, greens, roots, and seeds that are nutritionally superior to store-bought foods. Wild plants also provide medicine and materials for traditional technologies. Many common and accessible “weeds” are useful and can be found in our own backyards.
 Tend, Gather and Grow (Tend) is a K-12 place-based curriculum dedicated to educating people about plants, local landscapes, and the rich cultural traditions that surround them. Tend focuses on native and naturalized plants of the Pacific Northwest region and includes Northwest Native knowledge, stories, and plant traditions. The curriculum toolkit consists of a teacher guide, six modules, videos, Coast Salish stories, plant identification cards, posters, games, recipes, and a garden guide. The 60+ lessons align with Science, Technology, Engineering, Art, Mathematics (STEAM) education principles and Next Generation Science Standards. Here’s a glimpse at the main curriculum modules:
- Plant Guide – This module covers 20 northwest plants and includes 38 hands-on lessons. Teachers can choose lessons based on what plants are available, in season, and most relevant to students. Each plant overview contains information on identification, seasonality, where the plant grows, human uses, and ecological relationships. A K-12 lesson called Dandelion: The Useful Weed introduces students to the lifecycle of dandelion, how it improves soil quality, and how it benefits insects, grazing herbivores, and people. Two lessons for 6th to 12th graders dive deeper into making food and medicine from dandelions. Plants that are at risk for overharvest have not been included in the curriculum unless there is a specific emphasis on restoration
- Cultural Ecosystems Field Guide – This module is about reframing the settler/dominant narrative about Northwest Coast Native People. Typically, Native Communities in the Northwest have been characterized as hunter-gatherers. This is not an accurate representation, and erases the deep-time relationships and land cultivation practices of Native People. This module includes an overview lesson on cultural ecosystems and a field guide to camas prairies, saltwater beaches, food forests, wetlands, and urban landscapes. Students learn about reciprocity and explore how they might both receive the gifts of the land and give back to the land.
- The Herbal Apothecary – This module includes techniques for harvesting, processing, and preparing medicinal plants. Topics include herbal teas, infused vinegars, honeys, poultices, infused oils and salves, herbal baths, and aromatherapy.
Plant Technologies – This module investigates how plant qualities have been used for millennia to create human technologies. Students explore ways to gather, process, and make useful items including cordage, baskets, mats, tools, and dyes from plant materials. Lessons are rooted in STEAM concepts.
- Tree Communities – This module introduces common Northwest trees and how they are valued for food, medicine, and traditional technologies. Themes include tree identification, ecological relationships, and life skills that we can learn from trees including generosity, building community, willingness, adaptability, and resilience.
- Wild Food Traditions – This module engages students with native and wild foods from a Coast Salish perspective. Seasonal lessons include spring wild greens, summer berries, healthy snacks in fall, and traditional beverages in winter. Native American stories, cultivation practices, ethical harvest techniques, and recipes are woven throughout lessons.
 Our Tend, Gather and Grow development team (photo left) includes twelve people sharing a common passion for connecting people with plants, the land, and cultural traditions. Several of our team members have worked together in tribal health and natural resources programs and half are Indigenous. Over the years we have heard consistent requests for educational resources designed for youth. The Tend curriculum is our effort to meet that need. Collectively, we have knowledge and skills in teaching, environmental education, Northwest Native culture and storytelling, ethnobotany, herbal medicine, traditional technologies, art, media, social justice, and youth advocacy. Our team met monthly for several years to study plants in the seasons and co-design lessons and activities. Co-developing the curriculum has been an opportunity for our team to be in community with each other, share our love of plants, deepen our knowledge, and support each other along the way. We also worked with Native Elders, cultural specialists, and other regional experts in developing lessons—especially regarding storytelling and plant technologies. The curriculum includes quotes and instructions from these individuals.
Tensions
 There are inherent tensions in non-native people using this curriculum, including concerns of cultural appropriation and misuse of plants and cultural landscapes. The curriculum exists, as we all do, within a painful and persistent history of colonialism, white supremacy, and systematic oppression. Historic and ongoing colonial settler practices negatively impact Native People and their traditional lands. Plant communities have changed drastically and many important cultural foods and ecosystems are diminished and difficult to access. Cultural appropriation and a misuse of knowledge among settler communities has undermined tribal sovereignty in several ways, including researchers claiming copyright authority over Indigenous knowledge and the overharvest of plant communities. For instance, as the health benefits of mountain huckleberry are more broadly learned, huckleberry stands cultivated by Native Peoples for thousands of years have been damaged and overharvested by non-native foragers and commercial harvesters.
To address these tensions, the Tend team has collaborated with tribal Elders and cultural knowledge keepers to ensure that information in the curriculum is appropriate to share broadly. Some plants and plant knowledge have been purposefully left out. All stories and plant teachings are included with permission from the storyteller or plant knowledge keeper. We have also created a video called Honoring Plants, Places, and Cultural Traditions that features Indigenous educators offering tools and advice to teachers wanting to use the curriculum. The Tend, Gather and Grow Teacher Guide and trainings support educators in adopting the curriculum responsibly. The toolkit also encourages educators and young people to be advocates and allies for Northwest Native peoples, tribal sovereignty, and cultural ecosystems. Lastly, we are encouraging schools to integrate featured plants from the curriculum in schoolyards and have created an Ecosystem Garden Guide that includes plant lists and basic garden installation directions.
Ways People are Using the Curriculum
T end is adaptable to multiple learning environments, cultures, languages, participant ages, and abilities. We encourage educators and students to explore and add specificity around local language, culture, stories, and places as appropriate. We believe that cultural diversity is part of our richness as people. Educators can create opportunities for immigrant students to share their knowledge and traditions as well, and plant uses from around the world are included in the curriculum to encourage this.
The Tend curriculum is being implemented in a variety of settings including tribal schools, non-tribal schools, health and wellness programs, behavioral health programs, youth camps, and informal educational settings. Educators are also using Tend in various ways that meet their learning goals, fit their environment, and follow their students’ interests. Some schools focus on a plant each month (Wild Rose in September, Cattail in October, Doug Fir in November, etc). Some teachers are integrating Tend lessons into other courses like agriculture, nutrition, biology, ecology, social studies and the Since Time Immemorial Tribal Sovereignty curriculum. Teachers can also choose lessons and modules to accompany existing nearby landscapes like camas prairies or saltwater beaches and/or gardens or to accompany the creation of an ethnobotanical garden. Tend can also be the centerpiece of a full year-long course and we’ve designed a 180-hour Career Technical Education framework called Tend, Gather and Grow – Ethnobotany & Natural Resources Management to support this.
Tend Tribal Educator Cohorts
 The Tend team has facilitated year-long tribal community educator cohorts where 16–20 educators from Washington tribes gather monthly for full-day workshops. Our first two internships focused on serving Western Washington tribes and this year we are honored to work with tribes from the Plateau region.
The Plateau internship includes seventeen tribal food gatherers, teachers, community educators, birth justice advocates, Indigenous language teachers, Elders, and youth who represent Yakama Nation, Colville Confederated Tribes, Kalispel, Nez Perce, Spokane, and Coeur d’Alene Tribe. This internship is led by GRuB’s Wild Foods and Medicines Tribal Relations Lead, Mariana Harvey (Yakama) and Traditional Plants Educator and Tend development team member, Elizabeth Campbell (Spokane/Kalispel).
This internship meets regularly over the year to integrate the Tend curriculum into various communities, schools, and programs. Participants also build teaching and group facilitation skills, learn about how to identify, harvest, and prepare many local plants, attune to the seasons, deepen a connection to the land, practice storytelling skills, and more.
Often the most enriching outcome for these tribal internships is the community and relationship building among the participants. Our participants are leaders within the tribal food sovereignty movement and it is a lot of work to carry. We hear that our gatherings feel like a ‘retreat’ where people can learn together, share ideas, and deepen bonds to each other and the earth. Gatherings take place in each participating tribal community, allowing us all to gain a deeper understanding of each other’s tribal history, culture, and of course foods and medicines! While we were in Spokane, a common highlight among participants was hearing a traditional story about the tamarack tree. When we were in Yakima, many remarked that it had been a very long time since they had eaten many of the roots that were served that day, and others were eating them for the first time. There is joy that radiates from our participants after our gatherings and the beauty is they bring that joy and spark of knowledge back home to their communities. ❀
Learning about and from plants has been a wonderful foundation to connect with my students and colleagues, since it’s something everyone can relate to on some level. I have been especially moved hearing stories that have been shared by experts in the field, native teachers/elders, as well as unique family stories that have emerged from my students, colleagues, and friends.
–Charlie Sittingbull, North Thurstaon High School Science Teacher
Photos by Elise Krohn
by editor | Feb 7, 2019 | Climate Change & Energy, Schoolyard Classroom
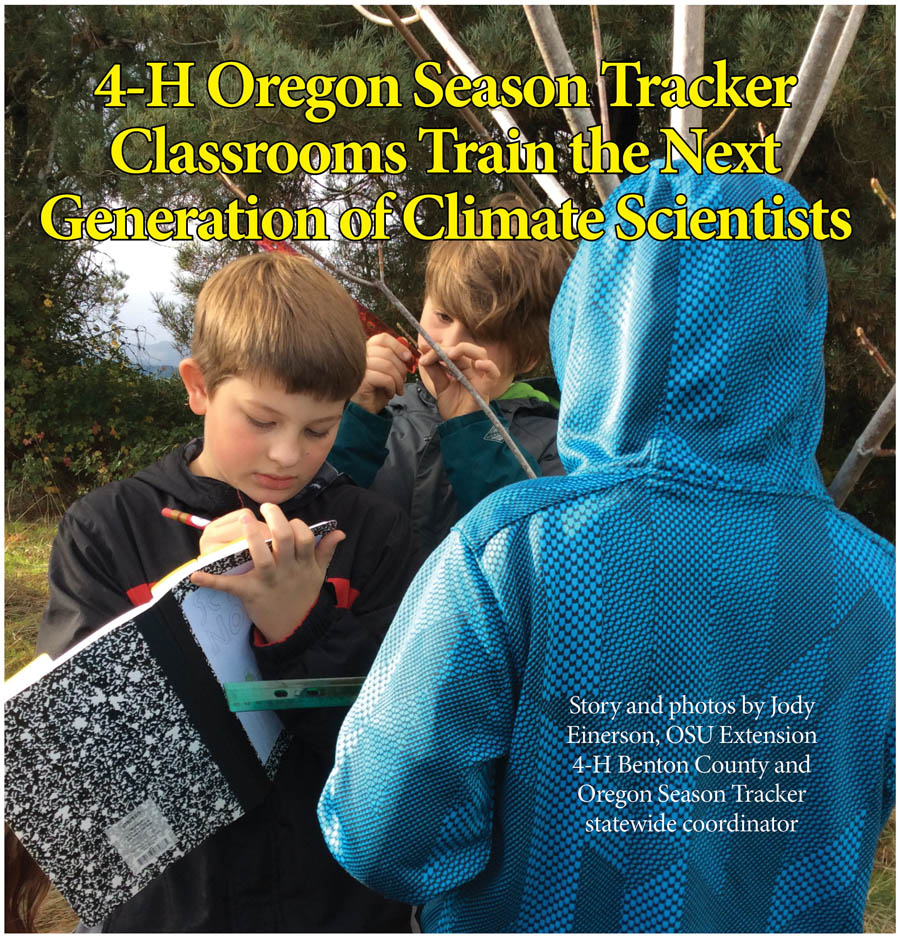
On a sunny fall day in Oregon students are outdoors learning about the new citizen science observation site in their schoolyard. With a mix of 4th and 5th grade exuberance and the seriousness of adults they are taking on the mission of gathering basic data for a section of their school yard scientific study and research area. These students are part of the Oregon Season Tracker 4-H classroom program that is regularly getting them outdoors for real world science. As the teacher explains, this is the first of many data gathering sessions as part of their yearlong commitment to the program. This real world data will support researchers to gain a better understanding of climate change across Oregon.
 regon Season Tracker (OST) 4-H classrooms are a companion to the Oregon State University Extension Oregon Season Tracker adult citizen science program http://oregonseasontracker.forestry.oregonstate.edu/ . In the adult program, volunteers are gathering and reporting their observations of precipitation and plant seasonal changes in a statewide effort. Started in 2013 and targeting adults, it quickly became evident to everyone involved that the program had clear applications to outdoor hands-on “experiential” science learning for students.
The foundation of the OST program is based on a partnership between OSU Extension and HJ Andrews Experimental Forest located in Blue River, near the midpoint of the Cascade Mountain range https://andrewsforest.oregonstate.edu/ . The Andrews is a leading center for long term research, and a member of the National Science Foundation’s Long-Term Ecological Research (LTER) Program. The 16,000 acre research forest in the McKenzie river watershed in the Cascade Mountains was established in 1948, with paired watershed studies and several long-term monitoring programs initiated soon after. Today, it is jointly managed by the US Forest Service and OSU for research into forest and stream ecosystems, and the interactions among ecological dynamics, physical processes, and forest governance.
Part of the success of the Oregon Season Tracker program is that we have also collaborated with national programs, Community Collaborative Rain Hail and Snow Network (CoCoRaHS) https://www.cocorahs.org/ and National Phenology Network (NPN) Nature’s Notebook https://www.usanpn.org/natures_notebook, as well as our local partner. A key role of our national partners is their ability to collect, manage and store the data, making it available both to professional and citizen scientists. This national connection makes sure the data is available long-term and easily accessible locally as well as nationally and beyond. Both of our national partners have easy to use web based visualization tools that allow volunteers and students to easily look at and interpret data. In the classroom this means not only are students helping ongoing professional research, they can also investigate or research their own science questions using the data of others. Partnering with these national database sites also allows OST to stretch our resources further, spending our time and energy supporting the volunteers and classrooms in our program.

Zero is important data when reading the rain gauge!
Back at the school, it is 8:30 am and a student team is checking and recording the level of precipitation for the last 24 hours. The rain gauge station is set up outside the school entrance and is clearly marked with a sign explaining what the students are doing. Parents and visitors can clearly see they are part of the Oregon Season Tracker 4-H program collecting precipitation and plant phenology data as citizen scientists. The sign calls attention to their efforts and gives the students a sense of pride in what they are doing.
Students use a program approved manual rain gauge that is standardized nationally. They become comfortable reading the gauge marked out in hundreds of an inch and how to conform to set data protocols. They learn not to round measurements for accuracy, to read using the bottom of the meniscus, and how to deal with an overflow event. All skills that have math applications for what they are doing. Depending on the grade of the students these skills are new or a refresher of what they already know, but important none the less.
Students learned the rain gauge skills at the beginning of the year in outdoor relay races using Super Soakers to simulate rainfall in their gauge. Teams vie to see who can get the most “rainfall” into their gauge. The casual observer might mistake this activity for recess, but they are having fun learning the needed math skills. By learning to read the manual gauge to .01 of an inch they are following the protocols set out by our national partner CoCoRaHS.
The daily precipitation observations are establishing a piece of the scientific process. As part of the team approach, the observations readings are verified before dumping out the day’s accumulation. Students begin to get a feel for what an inch of precipitation looks like, both as it falls from the sky and what it looks like in the gauge. The data collected is then passed on to another student team that hovers over the classroom computer, entering it in the national CoCoRaHS website. Data entered by 9:00 am is shared on an interactive map, for any visitor to the website to view.
The data submitted to the CoCoRaHS website is accessed and used by meteorologists, hydrologists, water managers, and researchers. It is also captured daily by the PRISM Climate Group, one of our local OSU partners. PRISM gathers climate observations from a wide range of monitoring networks (including CoCoRaHS), to develop short and long term weather models that are in turn used by still more groups and agencies reporting on and studying weather and climate. This is an important thing for all our adult and student observers to realize: their data is real, it is important, and it gets used.
So for those students that are worried that their data will just get lost in the mountains of reports submitted every day, I’d like to share this experience. This past year, I worked with a teacher that received an urgent email from the National Weather Service within a short time after the Monday morning rainfall report was entered in the database. The Weather Service continuously monitors for extreme weather, and were checking on the accuracy of the morning report of over 2 inches of rain. Quick sleuthing found the students had made an error in submitting their data. Instead of making a multiday report for the weekend they had made a single day report. This was an eye opening experience for the students, not only to realize their data is being used but also that scientists are depending on them to be accurate.
Monitoring a rain gauge is an easy lesson to expand or extend into other topics. Students can be challenged to look for weather patterns by comparing their own station with others across your county, state, and even the nation. Alternatively, by graphing daily data or comparing the rainfall data against topographic maps. These types of observations can challenge students to see patterns and make connections. This leads to investigating essential questions such as: how do these weather and climate patterns play out across the state and how does this effect what and who lives in these locations?
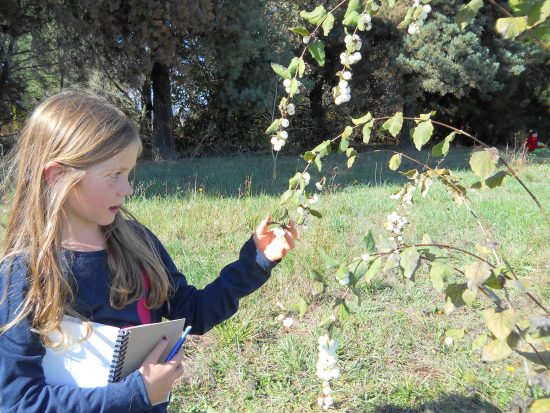
Observing fruiting on a common snowberry shrub.
OST students are also tracking plant phenology or growth phases over the year. They will be reporting on leaf out, flowering, fruiting, and leaf drop. By pairing these plant change observations with the precipitation readings, researchers have a powerful tool in the study of climate and the role it plays in plant responses. The OST program has identified eight priority native plant species that we encourage using if possible. These priority plants 1) mirror plants studied at the Andrews Forest, 2) have a large footprint across the state, and 3) are easy to identify. By targeting this small group of priority plants, we add density to the data collected making it more useful for our research partners. Our research partners at the Andrew’s Forest have many long-term studies looking at phenology and climate. They not only look at plant phenology but intensively study the ecosystem connections with watersheds, insects and birds. OST phenology data collected by students and volunteers allow the researchers to apply their findings and connections on a larger statewide scale.
Back at school, we now shadow a High School class. Students in an Urban Farm manage and work in a small farm on the school grounds, growing market vegetables and managing a small flock of egg laying hens. As part of their Urban Farm, they have planted a native pollinator buffer strip surrounding their large market garden. In this pollinator garden, they have planted vine maple, snowberry and Pacific ninebark, several of the OST priority plants, which they are observing weekly. They started their strip by studying the needs of the plants looking at soils, sunlight, and water needs. They then matched appropriate plants with their site, found a source and planted their buffer strip. Adding native plants to their buffer helps to attract and sustain the native pollinators in their garden. These students carry a field journal out to the garden and collect phenology data weekly as one of the garden jobs.
 Just like precipitation data, observing and reporting on plant phenology has a set of protocols that need to be followed to standardize the data, and ensure accuracy. OST and Nature’s Notebook (our national partner with the National Phenology Network) are looking for the timing of some distinct phenophases or plant lifecycle stages. The students concentrate on looking for leaf bud break, emerging leaves, flowers and buds, fruiting or seeds, and leaf drop. Nature’s Notebook has defined criteria for reporting each one of these stages.
We have found students as young as 3rd graders can be accurate and serious phenology scientists with a progression of training and understanding. It all starts with being a good observer, one of those important science skills. We have found one of the best tools to teach observation is to consistently use a field journal (e.g., field notebook, science journal, nature journal) when working outdoors. A field journal is a tool that helps to focus students and keep them on track, and to differentiate their outdoor learning time from free time or recess. A simple composition book works well, is inexpensive, and is sturdy enough to last through the seasons.
Start with a consistent expectation of what a field journal entry will include and help students to set this up before they go out in the field. Page prompts will help younger students focus on the task. At a minimum, all field journal entries should include the date, time, weather, and location. Depending on the focus of the day, have students include sketches, labels, and notes on colors. Have students include at least one “I wonder” question they would like to investigate and learn more about. Use the field journals as a tool to help students focus in on the plant they are observing for OST, but also encourage them to observe everything around them. This broader look is what leads students to make those ecological connections that just may spark their interest in science and lead to a lifelong study.

Phenology photo cards help with recording data.
As students get comfortable using a field journal we introduce phenology. Phenology is the study of nature’s seasonal changes, and a scientist who studies phenology is looking at the timing of those seasonal changes and the relationship to climate. Although OST focuses on plant phenology, the observational skills can apply to wildlife and insects, for example reproduction and migration. Phenology is an easy observable phenomena that can lead your science study and help meet Next Generation Science Standards http://www.nextgenscience.org/resources/phenomena .
We use a fun activity to introduce phenology and help students focus on what is happening outdoors in the natural world. Start by having students brainstorm in their field journal a list of all the things they can remember occurring outside during their birthday month. They can use plant cues, animal migrations, weather and light. For example,, “the earliest bud break has already happened, daffodils are blooming, the daylight hours become equal to the night hours, and the early bird migrants have arrived” (March). Once they have their list, pair them up with someone who does not already know their birthday. Then have them trade clues to see if they can guess each other’s birthday month. For younger students you may decide to help them with a class brainstorm and write the different nature clues on the board under headings for each month.
Once the student have a good understanding of the concept of phenology we go outside to start observing. OST has developed some handy plant phase field cards that have pictures and definitions for students to refer to and compare as we learn the phenophases in the field. Nature’s Notebook has printable data sheets that students can take out in the field to record their data. We have found that by copying these data sheets at the reduced size of 87%, they fit into the composition book field journal and can be glued in to create a long term record of data at the site.

Using technology to create an informational video.
Technology also plays a key role when doing citizen science with your students. Both Nature’s Notebook and CoCoRaHS have developed easy to use free apps. The versions work with both Apple and Android devices, so you could use them on phones and tablets as well as entering data online with classroom computers. We take it one-step further and use the tablets to document the student learning. Each student team works on creating an informational video of the project over the school year. We give them the option of creating a video to train other students or make a video to communicate their work back to our partner researchers at the Andrews Forest. This video becomes an assessment tool for teachers and is something that the students enjoy. We limit the videos to no more than a three minutes, which means they need to plan it out well. They spend some of the slower winter months creating a storyboard, writing scripts, filming and editing. A 5th grade teacher at Muddy Creek School said, “The iPads engaged my most distractible students. Also, everyone was vested in this project because of the fun the iPads bring to the table. Basically, iPads were a great motivation to learn the science.” For Apple products, you can download a free version of iMovie for creating and editing your final product. There are also free editing apps that can be used on Android devices. Here is one of our early attempts using a movie trailer format https://www.youtube.com/watch?v=1KdNPZp-1Fs
In exchange, “Researcher Mark” (Schulze) from the Andrews Forest is in a video we created for the students. Walking through the HJ Andrews Experimental Forest we visit one of the many phenology plots at the forest. Mark explains how the phenology plots are scattered across a gradient of elevations at the Andrews. This allows them to look at plant responses to weather and climate as well as delving much deeper, making connections to insects, birds, soils, drought and much, much more. Mark explains that he is gathering data on some of the very same species as the students, and looking for the same phenophases. He takes them on tour of one of the many meteorological stations at the Andrews to see the many different climate instrumentation and variables that they are studying. In the end, Mark shares how valuable their citizen science data is to the future study of climate.
So, what does the Andrews research community hope to get out of collaborating with OST citizen scientists? With the wealth of information they are amassing, they are also interested in seeing if the trends and patterns they are documenting on the Andrews hold true across the varied landscape of Oregon. There is no stream of funding that could finance this kind of massive scientific study except through tapping into the interest and help of volunteer citizen scientist including teachers and classrooms across Oregon. In this circular process of interactions between researchers and volunteers we hope to extend the conversations about climate science, and document the landscape level changes for the future.
It is easy to see how the students benefit, both by applying “real science” outdoors on a regular basis, and their career exploration as scientists. Teacher’s surveys report taking their students outdoors to work on science an additional 8 – 12 times per year because of this program. One Middle School science teacher says, “A great opportunity to get students collecting ‘real’ or authentic data. Given that the work is from a national source it also helped students take ownership of their project and feel its importance.” Students also learn and practice many of the NGSS standards and science practices working on and experiencing real world problems, not just reading about it in a text book.
Climate change is a real and sometimes overwhelming problem for many students, leaving them with a sense of helplessness. What impresses me the most with the students in the program is that they come away with a mindset of how they can have a positive impact in the field of climate science. When asked what they liked best about this program student surveys stressed that positive connection, “Helping scientists felt good.” “That I can make a difference.” “By helping researcher Mark, it was not just for fun it was real.” A good step in building the ecological thinkers and problem solvers we need for our future.
Jody Einerson is the OSU Extension 4-H Benton County and Oregon Season Tracker statewide coordinator.
by editor | Jun 13, 2014 | Forest Education
The LitTER Project: A field method for using litter-fall to study carbon cycling
by Lee Cain & Nick Baisley
Astoria High School Science Department
ABSTRACT
During a NASA funded Teacher-Researcher Partnership program focused on bringing Global Warming and Climate Change into the classroom, a long-term ecological study was created to get students into the field to research leaf litter fall as it relates to the carbon cycle.
Through photosynthesis, carbon in the atmosphere is converted into plant matter, which then will fall to the ground as it continues to be recycled in the carbon cycle. Our investigation is designed to answer the following question: “What is the rate at which carbon as leaf litter moves from a coniferous forest canopy to the forest floor (C-flux as Mg/ha/yr)?” A secondary question we are hoping to answer with this study is: “How does the rate of C-flux relate to coniferous age and management techniques?”
For comparison we selected one 60+ yr. old stand, a 30-50 yr. old recently thinned stand, and a young closed-canopy regenerating clearcut (15-20 yrs. old). In each stand we laid out two parallel transects, each with nine litter traps (plots) spaced 10 meters apart. Along each transect we also placed a HOBO temperature and light data logger.
We are collecting, drying, sorting, and finding the mass of leaf litter, and other sources of carbon, that have fallen into the traps. With only one fully completed set of data, we have yet to begin to answer the key questions of this study. We foresee a period of at least five years before we gather a significant data base. The purpose of this preliminary year was to choose our sites, establish transects, and work through any logistical or methodological challenges that present themselves. In the fall, students will begin taking regular field trips to the sites in order to collect and analyze the data.
 ig forests, big trees. Steep slopes, moss, and mycorrhizal strands of hyphae exposed under sliding boots. Climb up the slope, scramble down the log, lay the tape out, and spread the calipers. Then back up the slope again over the crisscrossed giant pick-up sticks to get the next measurement.
Later, taking a break for lunch, smashing microscopic biting midges against our sweaty arms, we have the chance to gaze upwards at the giant columns and wonder about what each tree has witnessed in its four or five centuries of existence. Then lunch is over, and it’s time to lay the tape out again.
This goes on day after day. Two science teachers from Astoria High School, we were in the H. J. Andrews Experimental Forest in the Cascade Mountains. This forest is part of the Long Term Ecological Research (LTER) Network, created by the National Science Foundation (NSF) in 1980 to conduct research on ecological issues that can last decades and span huge geographical areas. We were working with Dr. Mark Harmon of Oregon State University’s College of Forestry to take follow-up carbon storage measurements on forest research stands that had not been measured since the ‘70s and ‘80s.
In the following week in the computer lab, we take apart the measurements and put them back together again. On graphs, the data slowly begins to crystallize in our minds. We begin to realize that the carbon cycle is not working in the same time-frame as our short lives. It takes time for change to happen. Perhaps much more time than we have to repair the damage that we have done in a relative blink of an eye.
We now notice forests differently. We see logs in a way we did not before. Or rather, we see their absence. Replanted and managed forests appear to be empty – something is just missing. It is not just a sense of something missing – one can visibly notice the absence. No giant pick-up sticks lying crisscross on the forest floor. Such a void of stored carbon.
Back in the classroom, our challenge was to get students to see the actual carbon cycle as we have, and not just as an abstract diagram in a textbook. Then they might just be able to understand their own role in the cycle. We knew that time would be the enemy, because we never seem to have enough of it. But if we can get them to see the carbon falling, even one leaf at a time, then we will have begun the process. So we came up with the “LitTER Project,” a long-term ecological study (9th grade Integrated Science) of the movement of carbon from the forest canopy to the forest floor as falling leaves (litterfall). We realized it might take 5 years or more before we acquire any really significant database, but hoped that the process of getting kids to actually handle the litterfall would set into motion a greater awareness of the carbon cycle.
Our key investigative question was, “What is the rate at which carbon as leaf litter moves from a coniferous forest canopy to the forest floor (C-flux as Mg/ha/yr)?”
A secondary investigative question was, _“How does the rate of C-flux relate to coniferous age and management techniques?”
METHODS
Litterfall Traps — Three sites were selected within the Astoria area to give a wide range of forest ages and management approaches, yet also to be close enough to the high school to be practically accessible. For comparison we selected one 60+ yr. old stand, a 30-50 yr. old recently thinned stand, and a young closed-canopy regenerating clearcut (15-20 yrs. old).

At each site, two transects were laid out parallel, 20 m apart. All transects were set to have a 360 N orientation to be consistent in terms of solar angle of incidence. Nine litterfall traps (plots) were spaced along each transect at 10 meter plot intervals.
Each litterfall trap consisted of a black plastic rectangular floral tray (43 cm by 43 cm ~0.2 m2) lined with window screen to keep all litterfall from passing through the grid of the floral tray. Two wire surveyor flags were used to anchor through the trap into the forest floor and hold the mesh in place. The fluorescent flags helped to aid finding the traps on later visits. In addition, a surveyor’s ribbon with plot identification was tied to a nearby branch. Each plot was cleared of branches for 1 meter above the center of the trap.

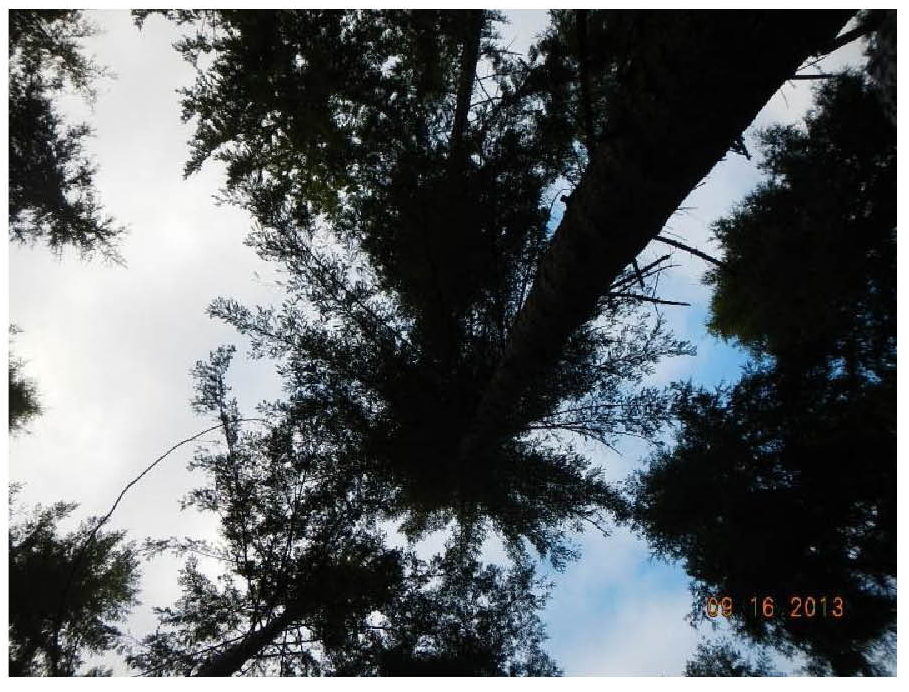
A canopy cover photograph was taken by standing directly over the trap and shooting straight up. A HOBO temperature and light data logger was also placed next to each transect. This photograph can be digitized for percent cover using Photoshop or a similar software. Percent cover can then be used to draw relationships with carbon flux rates.
Student Visits — Students were bussed to the study sites and allowed about 1.5 hours to collect the first samples from the traps. Each team of 2-3 students was responsible for collecting the samples from one plot, and re-setting the trap to level and clearing the forest floor to level, flagging the branch above the plot and taking the canopy cover photograph.
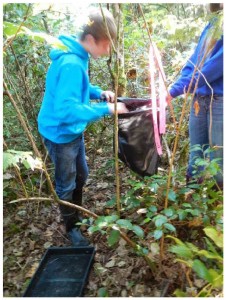
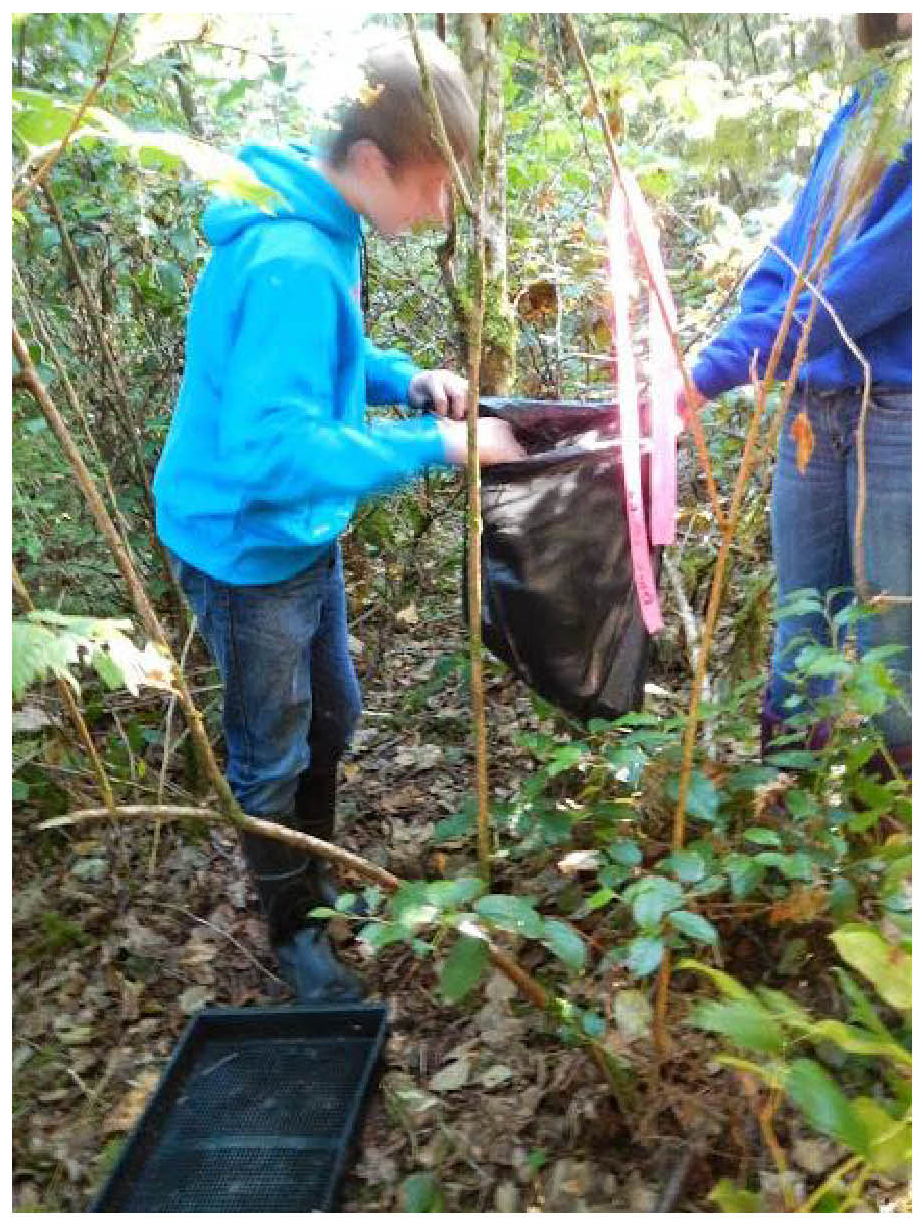
Processing Samples — Litter from the traps was placed into black plastic bags labeled with masking tape and trap information. The empty trap was returned to exactly the same position until the next collection date. The bags were tied shut and taken back to the lab, where they were then spread out to dry for two weeks at an average temperature of 25 C. In teams, students then sorted and weighed the litter samples to the nearest 0.1 grams (Table 1) in the following categories: needles, broadleaves, total leaf, woody matter, reproductive (seeds, flowers, etc.), total plant, mineral matter, and animal (bug parts).
GRAPHS AND FIGURES
Table 1 – Teams of students were given single data tables to initially record the sorted raw weights:

Table 2 – Excel was used to summarize the raw data:

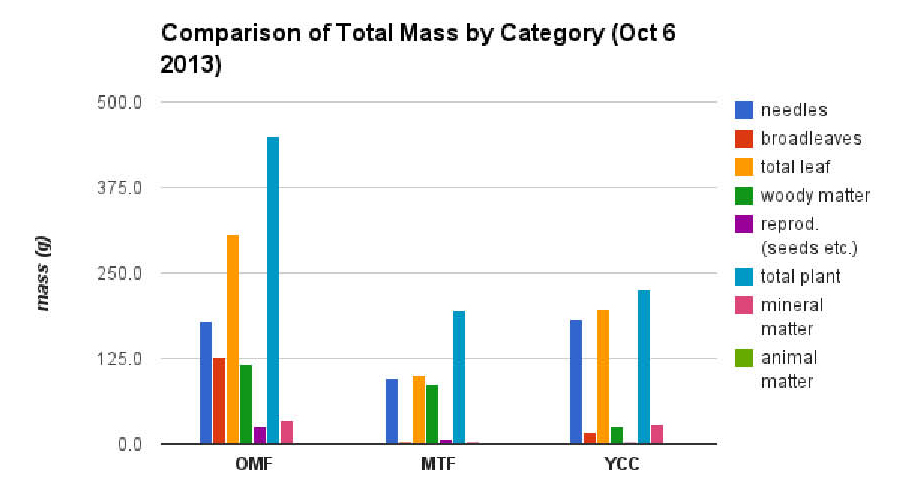
Figure 1 – Graph of summarized results of the first month of data collection:
DISCUSSION
While only one data collection had been completed at the time of publishing, the tables and figures in the previous section should give an idea of how we have arranged the data.
The most obvious result in the data, though it is early yet, is that there are apparently significant differences between study sites in terms of total leaf mass compared to woody matter. Over time, these differences should develop into differences in the rate of carbon flux in the three different systems. This should not be surprising, yet is exactly these sorts of differences that students will likely not be able to see prior to participating in a LitTER project. Because there is only one sample event so far, we have not yet constructed picture of the carbon flux as litterfall over time. What is not known at this time if these differences maintain their relative distances or if it equalizes over time.
 While we are looking forward to pulling out these and other relationships from the data, we are mostly excited by the potential of this project as a tool to get students involved in science inquiry. Students become highly engaged during the data collection and processing. There are also many directions that we can go with the student learning about climate change with this project as a base.
There are still a few areas in the project protocol that we need to revise. Originally, the data collection was planned as a monthly activity that rotated between six Integrated Science classes throughout the school year. But it immediately became apparent that this didn’t work with the busy pace of school and the unforeseen effect of weather (windstorms, rain, snow days).
It is also a major organizational effort to get even one class of student scientists out to the nearest of the sites, let alone bussing six different classes to all of them. To adjust to this, we are now planning on making the data collection quarterly. Three times throughout the year, we teachers will team to collect the data (about 2 hours per site). This approach may eventually fall into the form of a senior project, to be carried out by a capable science-minded individual or group of individuals. Our 9th grade students will now experience the field data collection just once per year, on a fall day devoted to the project. While this is not as ideal as more frequent field trips, we feel that this is a balance we have to make to accommodate the public school setting of our project. At least this way the students have that field experience to help them to better relate when participating in the multiple data analysis events in the laboratory.
REFERENCES
Muller-Landau, H.C. and S.J. Wright. (2010) Litterfall Monitoring Protocol, March 2010 version.
F.S. Peterson, J. Sexton, K. Lajtha. (2013) Scaling litter fall in complex terrain: A study from the western Cascades Range, Oregon. Forest Ecology and Management 306, 118-127 Online publication date: 1-Oct-2013.
This article was submitted for ED 901 – Researcher Teacher Partnerships: Making global climate change relevant in the classroom Spring 2014 ; Oregon State University & Oregon Natural Resources Education Program (ONREP)
by editor | Sep 3, 2013 | K-12 Classroom Resources
Plants and People
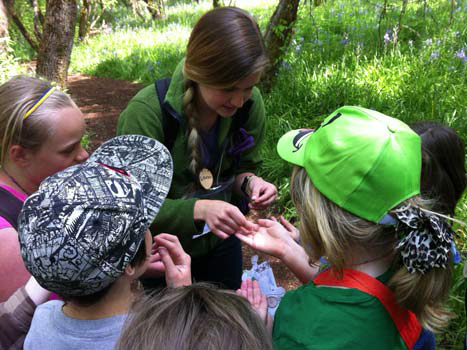
Three service learning teams from the University of Oregon Environmental Leadership Program tackle teaching children about the ecological and cultural importance of native plants.
.
.
by Kathryn Lynch
Environmental Leadership Program
University of Oregon
Read the article here:PlantsandPeople


 Tend, Gather and Grow (Tend) is a K-12 place-based curriculum dedicated to educating people about plants, local landscapes, and the rich cultural traditions that surround them. Tend focuses on native and naturalized plants of the Pacific Northwest region and includes Northwest Native knowledge, stories, and plant traditions. The curriculum toolkit consists of a teacher guide, six modules, videos, Coast Salish stories, plant identification cards, posters, games, recipes, and a garden guide. The 60+ lessons align with Science, Technology, Engineering, Art, Mathematics (STEAM) education principles and Next Generation Science Standards. Here’s a glimpse at the main curriculum modules:
 Our Tend, Gather and Grow development team (photo left) includes twelve people sharing a common passion for connecting people with plants, the land, and cultural traditions. Several of our team members have worked together in tribal health and natural resources programs and half are Indigenous. Over the years we have heard consistent requests for educational resources designed for youth. The Tend curriculum is our effort to meet that need. Collectively, we have knowledge and skills in teaching, environmental education, Northwest Native culture and storytelling, ethnobotany, herbal medicine, traditional technologies, art, media, social justice, and youth advocacy. Our team met monthly for several years to study plants in the seasons and co-design lessons and activities. Co-developing the curriculum has been an opportunity for our team to be in community with each other, share our love of plants, deepen our knowledge, and support each other along the way. We also worked with Native Elders, cultural specialists, and other regional experts in developing lessons—especially regarding storytelling and plant technologies. The curriculum includes quotes and instructions from these individuals.
 There are inherent tensions in non-native people using this curriculum, including concerns of cultural appropriation and misuse of plants and cultural landscapes. The curriculum exists, as we all do, within a painful and persistent history of colonialism, white supremacy, and systematic oppression. Historic and ongoing colonial settler practices negatively impact Native People and their traditional lands. Plant communities have changed drastically and many important cultural foods and ecosystems are diminished and difficult to access. Cultural appropriation and a misuse of knowledge among settler communities has undermined tribal sovereignty in several ways, including researchers claiming copyright authority over Indigenous knowledge and the overharvest of plant communities. For instance, as the health benefits of mountain huckleberry are more broadly learned, huckleberry stands cultivated by Native Peoples for thousands of years have been damaged and overharvested by non-native foragers and commercial harvesters.
 end is adaptable to multiple learning environments, cultures, languages, participant ages, and abilities. We encourage educators and students to explore and add specificity around local language, culture, stories, and places as appropriate. We believe that cultural diversity is part of our richness as people. Educators can create opportunities for immigrant students to share their knowledge and traditions as well, and plant uses from around the world are included in the curriculum to encourage this.
 The Tend team has facilitated year-long tribal community educator cohorts where 16–20 educators from Washington tribes gather monthly for full-day workshops. Our first two internships focused on serving Western Washington tribes and this year we are honored to work with tribes from the Plateau region.
