by editor | Jun 12, 2014 | K-12 Classroom Resources
Middle School Students Use Historic Snowpack Data to Gain Inquiry, Graphing and Analysis Experience
by Joe Cameron
Beaverton Middle School teacher

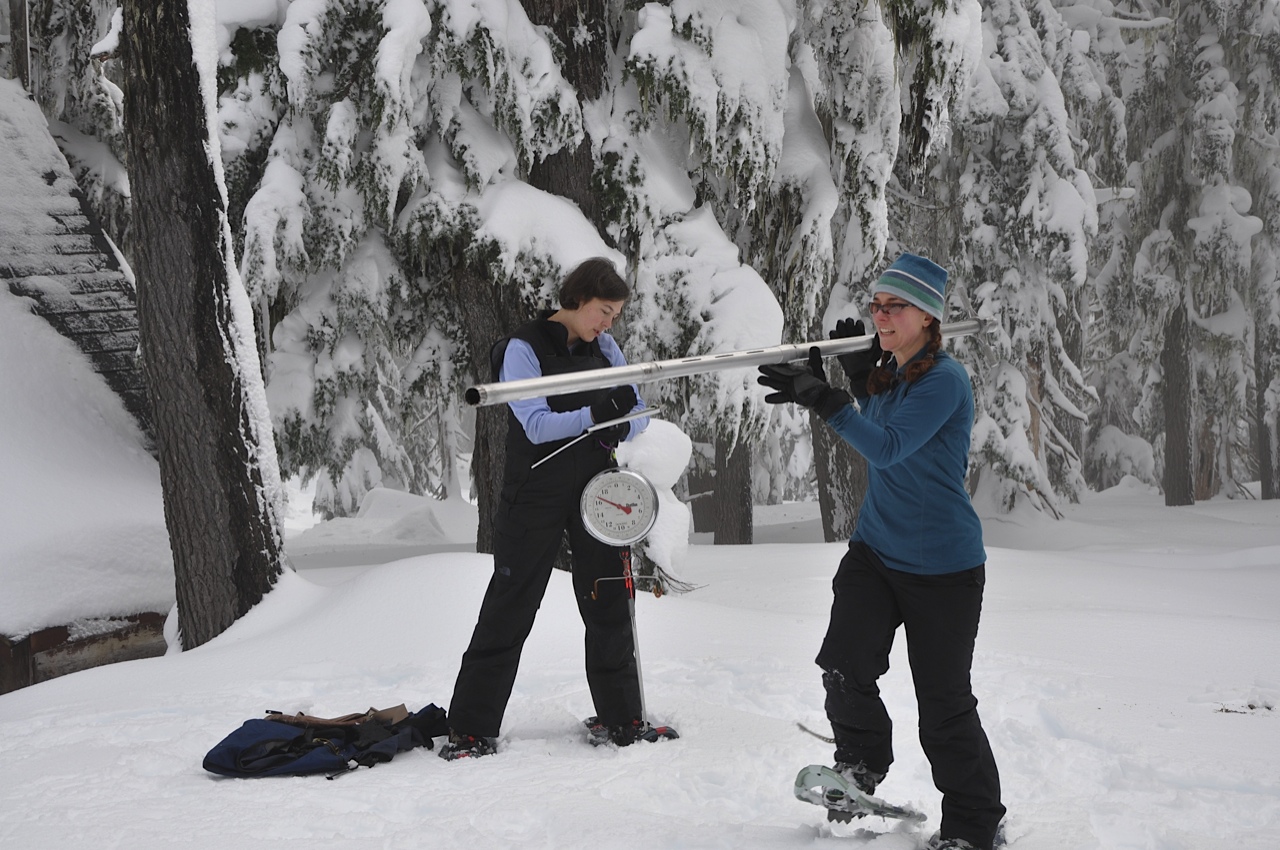
NRCS Oregon hydrologists Melissa Webb and Julie Koeberle measure snow on Mt. Hood. Courtesy of USDA.
What do you get when you mix researchers, teachers, authentic science opportunities and a group of GREAT people? You get three summers of intense work, reinvigorated teachers, new ideas for the classroom and lots of fun!
For the last three summers I was lucky enough to be involved in the Oregon Natural Resource Education Program’s (ONREP) Climate Change Institute where teachers are matched with researchers to bridge the gap between the classroom and field research. The last two years I worked with Oregon State University’s Dr. Anne Nolin and Travis Roth examining snow pack changes in the McKenzie River Watershed. Investigating snow collection sites and collecting data led to discussions on how best to get students involved in authentic research and science inquiry investigations.
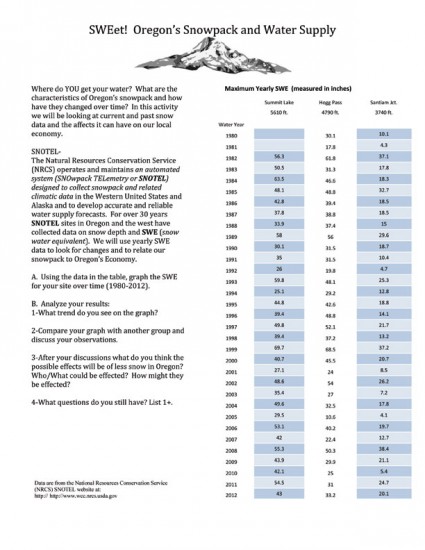
Handout for activity below.
One of my goals for the year was to get my students involved in authentic data collection and to gain more experience and practice in graphing. From this, SWEet! was born. SWEet is an activity that engages students in using historic snow data to investigate the SWE, or Snow Water Equivalent, and the changes taking place in the Cascade Mountains in Oregon. Students graph and analyze data from SNOTEL sites and compare their findings with others in class to make predictions about future snowpack. In extension activities students choose their own SNOTEL sites in the Western U.S. and monitor snow data monthly throughout the snow year. This type of activity will in turn introduce students to long-term ecological studies in progress and support them to begin studies of their own.
In doing this activity with my students we first investigated their particular sites. I found this helped them personalize the data and they were very involved, especially using this “local” data. Then using their data they were able to create comparative line graphs and look for trends in the data, even with a complex and varied data set. These trends were then used to hypothesize possible effects of changes in the snowpack to their world and the economy and ecosystems found in Oregon.
SWEet! Oregon’s Snowpack and Water Supply
Author: Joe Cameron
Time: 50+ minutes
Grade Level: 6-12
Background
SNOTEL-The Natural Resources Conservation Service (NRCS) operates and maintains an automated system (SNOwpack TELemetry or SNOTEL) designed to collect snowpack and related climatic data in the Western United States and Alaska in order to develop accurate and reliable water supply forecasts. For over 30 years, data on snow depth and SWE (Snow Water Equivalent) have been collected from SNOTEL sites throughout the western US. This activity will use yearly SWE data from three SNOTEL sites in Oregon to look for changes and relate our snowpack to Oregon’s economy and environment.
Introduction
Familiarize students with Snow Water Equivalent (SWE), which is the amount of water contained in the snowpack. A simple reference for background information is http://www.nrcs.usda.gov/wps/portal/nrcs/detail/or/snow/?cid=nrcs142p2_046155. Also, you can do a simple class demonstration by taking a 500ml beaker of snow (or blended ice) and melting it using a hot plate. I have students predict how much water will remain after the ‘snow’ is melted. Then, we calculate the percent water in the snow to give them an example of one way to analyze this type of data.
After getting the students comfortable with SWE, you can give them the SWEet! Oregon’s Snowpack and Water Supply activity page. When I led this activity, we read through the introduction as a class and then directed the students to graph the data provided, make sense of their plot, compare their results with others in class and then draw conclusions. This lesson leads to discussions of our changing climate and possible changes in store for the people, plants and animals of Oregon.
Objectives
Students will access long term ecological data.
Students will graph SWE data.
Students will compare their data with data from their classmates.
Students will identify possible effects of a decrease in snowpack.
Vocabulary
SWE-Snow Water Equivalent; the amount of water found in snow.
SNOTEL-automated system that records snow depth and related data in the western United States
Trend-a general direction that something is changing
Snowpack-the amount of snow that is found on the ground in the mountains; usually measured at specific sites.
Standards
Next Generation Science Standards (NGSS)
MS-ESS2-5. Collect data to provide evidence for how the motions and complex interactions of air masses results in changes in weather.
MS-ESS3-5. Ask questions to clarify evidence of the factors that have caused the rise in global temperatures over the past century.
Oregon Science Standards
Scientific Inquiry: Scientific inquiry is the investigation of the natural world based on observations and science principles that includes proposing questions or hypotheses, designing procedures for questioning, collecting, analyzing, and interpreting multiple forms of accurate and relevant data to produce justifiable evidence-based explanations.
Interaction and Change: The related parts within a system interact and change.
6.2E.1 Explain the water cycle and the relationship to landforms and weather.
7.2E.2 Describe the composition of Earth’s atmosphere, how it has changed over time, and implications for the future.
7.2E.3 Evaluate natural processes and human activities that affect global environmental change and suggest and evaluate possible solutions to problems.
8.2E.3 Explain the causes of patterns of atmospheric and oceanic movement and the effects on weather and climate.
8.2E.4 Analyze evidence for geologic, climatic, environmental, and life form changes over time.
Materials
For Demonstration:
1 500 ml beaker
1 50-100 ml graduated cylinder snow OR chopped/blended ice
1 hot plate
For Activity:
Copies of SWEet! Oregon’s Snowpack and Water Supply activity page
Graph paper
Optional: colored pencils/pens
Lesson Procedure
1. Give students the SWEet! Activity page.
2. As a class, read and review all directions.
3. Students may choose 1, 2, or 3 sets of data to graph. This option allows the activity to be modified to meet the individual students’ abilities. Also, students can create graphs that can be compared to multiple data sets.
4. Students graph the data in a line graph.
5. Students analyze the data. This part can be completed through drawing a trend line(s) on the graph, calculating averages, adding totals and/or comparing multiple data sets looking for similarities and differences. Note: having the students do their graphing using Excel spreadsheets is an option that is not always available in our school but from which the students would benefit.
6. Relate the observed trends in snowpack to possible effects in Oregon. Who/What will be affected? How will/might they be affected?
7. Students pose one other question OR concern they have after looking at their graphs and trends for possible additional exploration.
Extensions
1-Related current event articles from Science Daily:
Warming Climate Is Affecting Cascades Snowpack In Pacific Northwest
Found at http://www.sciencedaily.com/releases/2009/05/090512153335.htm
Global Warming to Cut Snow Water Storage 56 Percent in Oregon Watershed
Found at http://www.sciencedaily.com/releases/2013/07/130726092431.htm
2-Students can access current snow year data online. They go to SNOTEL website, choose a specific site and collect daily, weekly or monthly data for this site throughout the winter months (the snow year stretches from November to March). Students can also access historic data going back to the late 1970’s and early 1980’s for their sites.
References Science expertise was provided by the following Oregon State University Faculty: Dr. Anne Nolin – Professor and Travis Roth-Doctoral Student in the College of Earth, Ocean, and Atmospheric Sciences. Data are from the National Resources Conservation Service (NRCS) SNOTEL website at: http://www.wcc.nrcs.usda.gov
Acknowledgements These lessons were created using information learned in the Oregon Natural Resource Education Program’s Researcher Teacher Partnerships: Making Global Climate Change Relevant in the Classroom project. This project was supported by a NASA Innovations in Climate Education award (NNXI0AT82A).
Thanks to Dr. Kari O’Connell with the Oregon Natural Resources Education Program at Oregon State University and Dr. Patricia Morrell in the College of Education at University of Portland for their thoughtful review of this article.
Joe Cameron is a teacher at Beaverton Middle School in Beaverton, Oregon. He can be contacted at joe_cameron@beaverton.k12.or.us

by editor | Jan 2, 2014 | K-12 Classroom Resources
 by Shamin Graff
Lake Katherin Nature Center & Botanic Garden
Palos Heights, IL
 he sat quietly for several moments, watching and waiting. Suddenly, a streak of yellow flew by and then another. She quickly snapped a few photos on her phone as they flew off. Excitedly, she uploaded her photographs to iNaturalist, the first goldfinches that had been added to the biodiversity project she joined. She loved to see as all the new species being added by her and other citizen scientists like herself.
Across the United States, large institutions such as the Smithsonian National Museum of Natural History and the Field Museum of Natural History have developed spaces where visitors can watch scientists in action and ask questions about the work being done (Smithsonian Institution, 2013; The Field Museum, 2008). At the North Carolina Museum of Natural Sciences, an entire wing dedicated to the pursuit of science recently opened, which includes opportunities to engage visitors in citizen science (North Carolina Museum of Natural Sciences, 2012).
If your institution is anything like mine, creating a space for science and engaging visitors in citizen science programs may seem to be a greater project than time or financial resources can support. However, the resources put into a successful program can pay dividends over time for both the institution and its visitors. Knowing this, we dedicated a small space in our nature center to science and chose existing citizen science programs that could be tailored to meet the needs of our institution. The following is the evidence-based framework we created for doing so, based on extensive research that has been done in free-choice learning environments, including nature centers and museums.
The Case for Citizen Science
Citizen science is not a new idea, as participation in citizen science programs dates back to the 1700s in Europe where amateur bird enthusiasts recorded bird sightings (Dickinson, Zuckerberg & Bonter, 2010). Utilizing the Internet, today’s citizen science programs rely on crowdsourcing, or having large groups of people who each make a contribution, to collect data or classify previously-collected data. With many people sharing the work in this way, large data sets can be compiled that otherwise would not have been possible (Dickinson et al., 2010). These large data sets can not only be used to monitor a population or phenomenon, but also serve as a starting point for new questions to be researched (Bonter & Hochachka, 2009). For example, there is a project that asks participants to help transcribe old maritime records that can then be used to study climate change (www.zooniverse.org/project/oldweather) and several that ask people to help identify animals caught on camera traps. Both tasks require enormous amounts of man-hours and would be not feasible without the help of citizen scientists.
Besides the research benefits, participating in citizen science projects also have potential to increase scientific literacy. It can be difficult to assess, but research has shown that content knowledge can be gained through participation (Brossard, Lewenstein & Bonney, 2005). When participants are specifically instructed in science inquiry and the significance of the research being done, it may be possible to affect participants’ understanding and attitudes towards science in a positive way (Trumbull, Bonney & Grudens-Schuck, 2005; Jordan, Gray, Howe, Brooks & Ehrenfeld, 2011). Though more research is needed (Jordan et al., 2011), using citizen science to engage visitors over the long-term may also be a way to increase appreciation for nature and a caring attitude toward nature and biodiversity (Brewer, 2006), something we all strive for in environmental education.
 Creating a Space for Science
Although your institution may not have a wing to dedicate to science, there may be an area that can be used to introduce visitors to science, provide reference materials and perhaps even offer scientific equipment for visitors to use. For us, we needed a space that allowed visitors to overlook not only our site, but also our planned bird feeder installation and this guided our selection. As research in free-choice learning environments has shown, the physical attributes of a learning environment can affect visitor learning in both positive and negative ways. Visitors often feel more comfortable in smaller exhibit areas (Maxwell & Evans, 2002), so do not be discouraged by limited space. Although it is tempting to create an immersive environment where visitors can feel they have been transported to someplace else, this may actually overshadow any educational messaging (Pedretti & Soren, 2006). Instead, working to minimize distractions can increase visitor attention and potentially visitor learning (Maxwell & Evans, 2002). For us, that meant separating the area from the high-traffic by the entrance and shielding noise from the adjacent area for young children. Simply rearranging and strategically placing furniture created the ideal space for us. We also included a comfortable seating area to provide visitors a place to rest and that may encourage longer stay-times.
Choosing a Citizen Science Project
Choosing the citizen science project that fits the needs of your institution is important to the future success and support of the program. We chose projects with a local focus that visitors could participate in at our site in order to fit our institution’s mission. There are a wide variety of citizen science projects to consider. SciStarter (http://www.scistarter.com) provides a searchable database of citizen science projects around the world that may assist you in finding a suitable project.
Institutional resources should be considered when choosing a project. The time investment for some projects will be greater than others. Some projects require frequent reports, sometimes even daily. Still others have fees associated with participation, require specialized training, or use equipment that must be specially purchased.
It is also crucial to consider the target audience when choosing a project. Many projects will not easily lend themselves to being used with visitors. Some data collection may be too intensive for the visitor experience while others may have strict restrictions on reporting. In these instances, you may choose to participate as an institution and then share your contributions to the project with visitors. This could be expanded by offering visitors a similar activity to participate in, as we did with Project FeederWatch, a bird monitoring program through the Cornell Lab of Ornithology. Also, some projects may have data collection periods that may not coincide with times of highest attendance. For example, Project FeederWatch only runs from mid-November through early April each year (Bonter & Hochachka, 2009), when many nature centers in northern climates have a decline in attendance.
Developing Materials
When developing site-specific materials for your chosen citizen science project, you should consider including an explanation of scientific inquiry and the role visitors are taking by participating. This may help them develop a better understanding of how science research is conducted and the importance of citizen science (Trumbull et al., 2005). Research at science museums has shown that visitors often come away with a changed view of science, but it is one that sees science as a set of facts, not a collection of knowledge that is always evolving (Rennie & Williams, 2006). We can help science literacy by showing visitors that though some scientific knowledge has been rigorously validated, there is still much that is not fully understood, even after years of study. Without addressing these misconceptions directly, we may unknowingly undermine science literacy goals.
Our institution does not have naturalists or docents who are available to facilitate the citizen science area, a major hurdle for a project like this. To support self-directed learning and participation in citizen science projects, easy-to-follow materials are recommended (Banz, 2008), such as signage, brochures and worksheets. These self-guided activities can also provide visitors with a framework designed to help them conduct their own inquiries, allowing them to see firsthand the nature of science (Allen & Gutwill, 2009). Hopefully, this will also promote repeat visits to the area and enhance learning (Banz, 2008).
Program Assessment
While developing a citizen science program, program assessment should be discussed. Simply having visitors participate was our initial goal, and multiple iterations of materials and methods are still being used to reach that goal. However, research on the impact of citizen science is limited and contributions are needed in both data and research methods (Brossard et al., 2005). If resources allow, assessment of content knowledge, scientific inquiry, impact on stewardship and changes in conservation values are highly encouraged, and are in the planning stages for our project.
The Framework in Action
At Lake Katherine Nature Center & Botanic Gardens (LKNCBG) in suburban Chicago, Illinois, the first implementation of a citizen science program following this framework is underway. With only three full-time staff members, resources are limited and minimal funds were used for the project. However, as our mission seeks to “promote environmentally sustainable choices through education, outdoor experiences and scientific research,” it has been important goal for 2013 to begin to introduce citizen science to the 26,000 visitors that come through the nature center annually (LKNCBG, 2013).
The physical space for our citizen science center was formed using a 130 ft2 area inside our nature center. The area provides a small reference library, comfortable seating and views of our bird feeders. There is literature for each citizen science project located in the citizen science center, along with worksheets and identification guides. There is also a chalkboard for visitors to record and share their data.
Three citizen science projects were selected to help us reach our goal. As an institution, we are participating in Project FeederWatch (www.birds.cornell.edu/pfw/), a program that collects bird counts at feeders. For visitors, we are offering a paper-based activity similar to the actual data collection for the project. We have also started a project online at iNaturalist (www.inaturalist.org) that allows visitors to record observations of wildlife seen at our site in order to compile a biodiversity atlas. Finally, we have joined Project Budburst (www.budburst.org) as a Botanic Gardens Partner to encourage visitors to gather data about seasonal changes in ten target plant species onsite.
These specific projects were chosen mainly to help build visitors’ ecological knowledge. Research has suggested that as cultures become more affluent, this ecological knowledge is lost (Pilgrim, Cullen, Smith & Pretty, 2008). The projects we have chosen offer an opportunity for visitors to learn about species and their roles in local ecosystems, which we hope will help address this loss of knowledge. Also by increasing ecological knowledge, visitors may become more aware of their local environment and the issues it faces (Cooper, Dickinson, Phillips & Bonney, 2007), potentially leading to greater support for restoration and preservation of natural lands, including our own site.
Although it is a modest start, and interest from visitors is just beginning, we hope that citizen science will become an integral part of the visitor experience to LKNCBG and will inspire other environmental education institutions to develop similar programs. We expect that it will take time to build a culture of science at our institution and this is just one step in that process. In the future, we plan to evaluate our program through visitor surveys to not only improve our own programs, but also to share with the environmental education community.
Taking the First Step
A citizen science center may be a great way to further your institution’s mission and goals. Using this research-based framework as a guide, it is possible to create a place to engage visitors through citizen science, even when resources are limited. Through these programs, environmental education institutions can play a key role in increasing their visitors’ science literacy and ecological knowledge. With time, visitors may start taking a more active role in stewardship and provide greater support for local environmental causes. It all starts with taking the first step.
References
Allen, S. & Gutwill, J. P. (2009). Creating a program to deepen family inquiry at interactive science exhibits. Curator, 52, 289-306. doi: 10.1111/j.2151-6952.2009.tb00352.x
Banz, R. (2008). Self-directed learning: Implications for museums. The Journal of Museum Education, 33(1), 43-54.
Bonter, D. N. & Hochachka, W. M. (2009). A citizen science approach to ornithological research: Twenty years of watching backyard birds. In T. D. Rich, C. Arizmendi, E. Demarest, & C. Thompson (Eds.), Tundra to Tropics: Connecting Birds, Habitats and People (pp. 453-458). Proceedings of the 4th International Partners in Flight Conference, McAllen TX.
Brewer, C. (2006). Translating data into meaning: Education in conservation biology. Conservation Biology, 20, 689-691. doi: 10.1111/j.1523-1739.2006.00467.x
Brossard, D., Lewenstein, B., & Bonney, R. (2005). Scientific knowledge and attitude change: The impact of a citizen science project. International Journal of Science Education, 27, 1099-1121. doi:10.1080/09500690500069483
Cooper, C. B., Dickinson, J., Phillips, T. & Bonney, R. (2007). Citizen science as a tool for conservation in residential ecosystems. Ecology and Society, 12(2), 11.
Dickinson, J. L., Zuckerberg, B., & Bonter, D. N. (2010). Citizen science as an ecological research tool: Challenges and benefits. Annual Review of Ecology, Evolution, and Systematics, 41, 149-172. doi: 10.1146/annurev-ecolsys-102209-144636
Jordan, R. C., Gray, S. A., Howe, D. V., Brooks, W. R. & Ehrenfeld, J. G. (2011). Knowledge gain and behavioral change in citizen-science programs. Conservation Biology, 25, 1148-1154. doi: 10.1111/j.1523-1739.2011.01745.x
Lake Katherine Nature Center & Botanic Gardens. (2013). 2012 Annual Report.
Maxwell, L. E. & Evans, G. W. (2002). Museums as learning settings: The importance of the physical environment. The Journal of Museum Education, 27(1), 3-7.
North Carolina Museum of Natural Sciences (2012). New wing opens with 24-hour celebration Friday, April 20. Retrieved from http://naturalsciences.org/about-us/news/new-wing-opens-24-hour-celebration-friday-april-20
Pedretti, E. & Soren, B. J. (2006). Reconnecting to the natural world through an immersive environment. Canadian Journal of Science, Mathematics and Technology Education, 6(1), 83-96. Abstract retrieved from http://www.tandfonline.com
Pilgrim, S. E., Cullen, L. C., Smith, D. J. & Pretty, J. (2008). Ecological knowledge is lost in wealthier communities and countries. Environmental Science and Technology, 42, 1004-1009. doi: 10.1021/es070837v
Rennie, L. J. & Williams, G. F. (2006). Adults’ learning about science in free-choice settings. International Journal of Science Education, 28, 871-893. doi: 10.1080/09500690500435387
Smithsonian Institution. (2013). FossiLab. Retrieved from http://paleobiology.si.edu/FossiLab/index.html
The Field Museum. (2008). DNA Discovery Center. Retrieved from http://archive.fieldmuseum.org/dna/
Trumbull, D. J., Bonney, R. & Grudens-Schuck, N. (2005). Developing materials to promote inquiry: Lessons learned. Science Education, 89, 879-900. doi: 10.1002/sce.20081
Shamim Graff is a volunteer at the Lake Katherine Nature Center & Botanic Gardens in Palos Heights, Illinois.

by editor | Nov 4, 2013 | K-12 Classroom Resources, Marine/Aquatic Education

1. Climate Change: Connections and Solutions
Facing the Future offers this free two-week curriculum unit for middle school and high school which encourage students to think critically about climate change and collaborate to devise solutions. Students learn about climate change within a systems framework, examining interconnections among environmental, social, and economic issues.
https://www.facingthefuture.org/Curriculum/PreviewandBuyCurriculum/tabid/550/List/1/CategoryID/16/Level/a/Default.aspx#.UmbDNBCRh8k
2. Climate Change Teacher Resources
Windows to the Universe provides interlinked learning resources that support a variety of topics, including online content for browsing or to support an introductory online course on climate change, teacher professional development resources, classroom activities, and online interactives.
http://www.windows2universe.org/teacher_resources/climate.html

3. ClimateChange LIVE! – Resources and Online Webinars
The U.S. Forest Service and partners offer this website to bring climate learning to you through a series of webcasts, webinars, and online climate education resources. The materials include climate education resources and programs gathered from 17 federal agency and NGO partners. The National Wildlife Federation is hosting a series of six webinars in connection with the ClimateChange LIVE! materials; you may register for one or more webinars at a time.
http://climatechangelive.org/

4. Teaching Climate
Teaching Climate offers a searchable database of reviewed K-12 climate education resources. The resources have been reviewed by subject experts for scientific accuracy, pedagogical soundness, and usability. Topics include Climate Systems, Measuring & Modeling Climate, Human Responses to Climate, and more.
http://www.climate.gov/teaching

5. Citizen Science: Project FeederWatch
Those interested in citizen science can join the thousands of FeederWatchers across North America who count the birds at their feeders from November through early April. All participants receive the project’s annual summary publication and the Cornell Lab’s quarterly. New project participants receive a bird-identification poster, bird-feeding information, and instructional materials.
https://store.birds.cornell.edu/Project_FeederWatch_s/42.htm

6. CMOP: Studying Coastal Margins
The Center for Coastal Margin Observation & Prediction, an NSF Science and Technology Center partnership of Oregon Health & Science University, Oregon State University, University of Washington and others, focuses on coastal margins. The website offers a collection of activities and curricula that can help you use their data resources. Check out the materials on coastal hypoxia, vertical density gradients, drifters and currents, and more. Some of the materials are available in both English and Spanish.
http://www.stccmop.org/education/k12/teacher_resources/activityarchive
7. Urban EE Resources for High School Teachers
The LEAF Anthology of Urban Environmental Education is available online. The anthology is a collection of lessons and activities designed to help high school educators infuse urban environmental themes into their curriculum. Sections include Natural Cities, Human Cities, and Evolving Cities.
http://www.nature.org/about-us/careers/leaf/resources-for-teachers/leaf-anthology-of-urban-environmental-education.xml


