by editor | Mar 26, 2015 | Questioning strategies
Is Science Communication? Can students, moving around and talking, do science?

by Jim Martin
CLEARING Associate Editor
You’re trying to answer a question. Student work groups have designed their own investigations to understand the question, develop inquiries to investigate what they have found and thought about, then present their findings to the other work groups in a symposium. There are many processes going on here. Let’s look at a few as they engage them to see what emerges in addition to discovering and testing possible answers to the original question.
Start small. In groups, you help students learn to communicate effectively. How to say, “Here’s what I think, and why;” and to listen and respond when other group members do the same. This is very basic to developing effective work groups. You have them keep notes on these conversations, and use them to elicit concepts, plan work, etc. (Basic, but essential. They need to know why they think what they do, and make what they think and why clear to others. And to learn to be advised or informed by others in their group.)
When your groups are communicating effectively, you observe for outcomes of their collaborative discussions. Do they understand their data, its patterns, its shape in graphs, etc. Are they showing signs of being able to relate data patterns to their question: Is it answered? What is the convincing evidence? What if the evidence doesn’t support their guesses about the answer to question? Or, does their question itself come into question? Are they becoming less mechanical and more purposeful in their work?
Further questions can move the groups along the learning curve by developing their critical thinking capacities: Are their interpretations of data supported by evidence? How confident are they of their data? Can they explain or justify data interpretations they have made, and their validity? What do their interpretations say about possible next steps?
You can continue to build on this conceptual foundation, each step easier because the foundation is becoming broad and more stable. You have them assess the design of their investigation and interpretations of data: How certain are they that they got the right data and used the best techniques of data acquisition? How certain are they that their data do, in fact, tell them what they need to know? Has their knowledge and expertise increased during this process? How much do they really know? Questions like these will tend to focus their thoughts on how they are learning and doing. Metacognition. Students who know how to learn know how to learn. Communication within effective work groups helps generate this capacity.
When they are ready, you have the groups report in a symposium. This is where their communication skills will be called upon to build conceptual understandings. How familiar are they with their evidence and its interpretation? How well do they comprehend other groups’ data and interpretations? How well do they generalize what they’ve learned and developed about collaborative communication within their work groups? Do they move it outward to carry on effective discussion with all of the work groups in the class? When an entire class develops the capacity to engage in substantive conversation about what they are learning, they’ll learn and nail down more than you could ever teach them using the publishers’ prepared materials and recommendations in the Teachers’ Editions.
Learning about science, but not doing science, does not develop the capacities described here. By only collecting and reporting data, students don’t engage the critical thinking capacities of their brain. I’ve observed science classes in which students looked up the boiling point of a liquid, say water, boiled the liquid and noted that it did boil at that temperature. What do they communicate amongst themselves? Is communication actually involved here? Or, are they simply engaging a perfunctory ritual? Might they have learned more if they had heated 3 or 4 liquids, noted their boiling points (or figured out how they’d know the boiling points, then test that), then looked up boiling points and made a guess about what their liquids were?)
Nor do they develop their capacity for conceptual learning when they simply learn about science, and commit science facts to memory. When students do engage in self-directed inquiries, examine the relevance of their collected data, critique it and the process of collecting it, and formulate interpretations they agree upon, they become involved and invested in the work, and empowered as persons. Engaging life. Engaged students are learning students. What our schools need today.
There’s not a lot of information out there on how to engage this part of teaching. There should be. This kind of work supports critical thinking, so it is of value. Critical thinking uses a part of the cortex that is especially well-organized for conceptual learning. That’s the prefrontal cortex, where relevant information from associative memories throughout the brain are brought together in working memory to nail down this new learning, then send it back out to associative memory; not as a fact to memorize for a test then forget, but as something more akin to common sense – something integrated into associative memory that you ‘just know.’
This critical thinking system turns on when you ask a question that is meaningful to you, and seek an answer to it. Science inquiry is a perfect complement and extension of this cortical learning system. In contrast, learning simply to prepare for a test won’t, of itself, entrain critical thinking. Instead, because of its aversive nature, learning content in order to answer test questions is accompanied by some level of anxiety, and entrains the limbic system, which isn’t good at engaging critical thinking. At least in this context, learning facilitated by anxiety about passing a test.
As the Common Core State Standards (CCSS) and Next Generation Science Standards (NGSS) continue to influence teachers’ and students’ experience in school, they present some level of anxiety to many, whether from an unfamiliar expectation for performance, change from structured, curriculum-directed teaching and learning to a more open-ended, active learning model, or from increased paperwork and accounting with no accommodating increase in free time for such work. Anxiety is processed through the limbic system, which impacts how the brain learns; which of its resources are freed for the task. As student and teacher stress levels increase, it becomes increasingly difficult to engage critical thinking. Instead, the limbic system, busy processing anxiety, increasingly limits communication with the prefrontal cortex, where critical thinking does its work. Instead, learning is limited to simple thoughts, which remain connected solely to the need to pass questions on a test, with little or no integration into associative memory, as occurs in critical thinking.
On the other hand, when students and teachers are free to explore new learnings (which the CCSS and NGSS seem to be interested in), to ask questions and seek answers to them, the limbic system supports this work with a heightened sense of pleasure and excitement, and feelings of well-being and inquisitiveness. And by assuring the doors to the prefrontal cortex are open.The different limbic involvements in learning are entrained by the properties of the learning environment. As they were when our brain evolved in the savannah during the Pleistocene. Might we use that history to revisit how we teach? How we organize student-student interactions while they learn? In the classroom and on-site in the natural world? In these cases, the limbic supports the work of the cortex, especially the prefrontal cortex, where working memory resides, and the brain’s conscious executive functions do their work. Work in which goals direct effort, reasoning and abstract thought are supported, and critical thinking takes place. Where we actively construct knowledge and commit it to long-term associative memory; ask questions, design investigations, develop needs-to-know which drive us into the information we seek, desire to complete and communicate our work.
When we are driven only by anxiety about not being able to answer questions on tests, this wonderful part of our brain is lost to us. The limbic system limits its use, and we simply memorize disconnected bits of information long enough to use them on a test, then forget. Are we teaching for fight or flight, or for higher-order critical thinking?
Used knowledgably, communication as practiced in doing science has the capacity to produce a foundation for critical thinking. By the information it generates, the testing of the information, and its processing and communication, it involves and invests students in critical thinking; in using their prefrontal cortex, its executive and working memory functions. The key feature is that the students, not the teacher, are involved in constructing knowledge. The teacher, while responsible for producing an environment where a constructivist approach to learning will probably happen, becomes a facilitator of their work. A difficult transition for many of us to make. I went into it willingly, but once committed, sorely missed lecturing and wowing students with the wondrous things I could show them in the lab. In spite of this, when I would pull out my old lesson plans, it would be immediately clear to me that this constructivist model was much, much more effective and empowering. And I eventually discovered this was because it used those sites and connections in the brain which were organized to engage conceptual learning. Something my pre-service and graduate education in teaching never addressed. It should have. Had it, and we learned as our brain is organized to learn, we just might have learned well.
Communication, when it is substantive, has the capacity to facilitate critical thinking. It does this by requiring us to consider what we are saying and doing, which is a readily useable road to the prefrontal cortex and working memory. Sort of like working in a shared workspace, a place with all the resources and facilities you need to focus on what you are learning, and the executive capacity to follow up on what you have learned.
 This is a regular feature by CLEARING “master teacher” Jim Martin that explores how environmental educators can help classroom teachers get away from the pressure to teach to the standardized tests,and how teachers can gain the confidence to go into the world outside of their classrooms for a substantial piece of their curricula. See the other installments here, or search Categories for “Jim Martin.”

by editor | Feb 23, 2015 | Environmental Literacy, Indigenous Peoples & Traditional Ecological Knowledge, Marine/Aquatic Education, Place-based Education, STEM
It Takes a Community to Raise a Scientist:
A Case for Community-Inspired Research and Science Education in an Alaskan Native Community
By Nievita Bueno Watts and Wendy F. Smythe
The quote, “lt takes a village to raise a child,” is attributed to African tradition and carries over to Alaskan Native communities as well (Hall, 2000). Without the support of their community and outside resources, Alaska Native children have a difficult time entering the world of science. Yet increasing the awareness of science, as a tool to help a tribal community monitor and maintain the health of their environment, introduces conflicts and misconceptions in context of traditional cultural practices. Rural communities depend upon traditional food harvested from the environment such as fish, wild game, roots, and berries. In many Native Alaskan villages the health of the environment equals the health of the people (Garza, 2001) . Integrating science with culture in pre-college education is a challenge that requires sensitivity and persistence.
 The Center for Coastal Margin Observation and Prediction (CMOP) is a multi-institutional, National Science Foundation (NSF) Science and Technology Center that takes an interdisciplinary approach to studying the region where the Columbia River empties into the Pacific Ocean. Two of CMOP’s focus areas are biogeochemical changes affecting the health of the coastal margin ecosystem, and socio-economic changes that might affect the lives of people who harvest and consume fish and shellfish.
The Columbia River waters touch the lives and livelihoods of many people, among them a large number of Pacific Northwest lndian tribes. These people depend on the natural and economic resources provided by the Columbia River. Native peoples from California through Alaska also depend on resources from their local rivers, and, currently, many tribes are developing-a workforce trained with scientific skills to manage their own natural resources in a way that is consistent with their traditional way of life. The relationship between Traditional Knowledge (TK) and practices, which are informed by centuries of observation, experimentation and carefully preserved oral records, and Western Science, which is deeply rooted in the philosophies and institutions of Europe, is often an uneasy one.
National progress is being made to open pathways for individuals from Native communities to Western Science higher education programs and back to the communities, where tribal members are empowered to evaluate and monitor the health of their environment. CMOP is part of this national movement. CMOP science is developing tools and techniques to observe and predict changes in the river to ocean system. CMOP education, an essential element of CMOB supports American lndian/Alaska Native students in pursuing academic and career pathways focusing on coastal margin sciences (Creen et al., 2013). One of CMOP’s initiatives is the CMOP- School Collaboratories (CSC) program.
CMOP-SCHOOL COLLABORATORIES
The CMOP-school Collaboratories (CSC) program is based on the idea that Science, Technology, Engineering, and Mathematics (STEM) pathway development requires an intensive and sustained effort to build relationships among science educators, students, school personnel, and the tribal community. The over-arching goal is to broaden participation in STEM disciplines. CMOP educators developed the CSC model that includes integration strategies for a community, development of appropriate lessons and field experiences and student action projects that connect local and traditional knowledge with science. Educational experiences are place- based, multi-disciplinary and culturally relevant. The objective is to open students’ minds to the reality of the need for scientists with many different world views and skill sets working together to address our planet’s pressing problems in a holistic manner. CMOP seeks to encourage these students to be part of that solution using both Traditional Knowledge and STEM disciplines.
The program encourages STEM education and promotes college preparatory awareness. This CSC program has three unique characteristics: it introduces coastal margin science as a relevant and viable field of employment; it integrates STEM learning with Traditional Knowledge; and, it invites family and community members to share science experiences. The example presented in this article describes a four-year program implemented in a small village in Southeast Alaska, 200 miles from the capital city of Juneau.
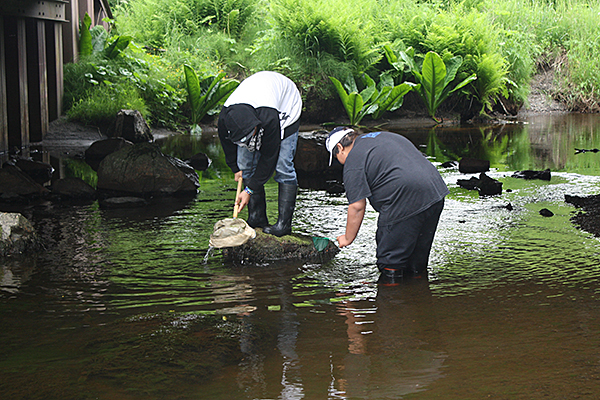
Figure 1: Students, scientists, a cultural expert. and a teacher with scientific equipment used to collect data from the river.
ALASKA NATIVE VILLAGE CASE STUDY
 Wendy Smythe, a CMOP doctoral candidate and principal investigator for an NSF Enhancing Diversity in the Geosciences (OEDC) award, is an Alaska Native Haida. As she advanced in her own education, she wanted to share what she had learned with the youth of her tribal community, striving to do so with the blessing of the tribal Elders, and in a way that respected the Traditional Knowledge of the Elders. Dr Bueno Watts is a mentor and expert on broadening participation. She acts in an advisory capacity on this project.
The village school consists of l5 staff members and 50 K-l2 students, with the school experiencing high administration turnover rates. ln the first two years of the program we recruited non-native graduate students to participate in the CSC program. This effort provided them experience working in Native communities. ln the last two years we recruited Native American undergraduate interns to teach lessons, assist with field activities and provide students with the opportunity to become familiar with Native scientists [Figure 1]. lnterns formed part of the science team.
STEPS TO GAIN ENTREE TO A VILLAGE
The community must support the concept to integrate science education with traditional practices. Even for this Alaska Native (Smythe), the process of building consensus from the tribe and gaining approval from the Elders and school district for the program was a lengthy one. The first step required letters of support from school district and tribal leaders. The difference in geographical locations proved difficult until Smythe was able to secure an advocate in the tribe who spoke for her at tribal meetings. Face-to-face communications were more successful than distance communications. Persistence proved to be the key to achieving success at getting the consensus of community leaders and school officials’ support. This was the top lesson of l0 learned from this project (Table l).
Traveling to the school to set up the program is no small feat and requires extensive coordination of transportation and supplies. A typical trip requires a day-long plane ride, overnight stay in a nearby town to prepare and gather supplies, a three-hour ferry ride, acquisition of a rental truck and a one-hour drive. Accommodations must be made to board with community members.
The development of appropriate lessons for the curriculum engaged discussions with tribal Elders and community Ieaders on an individual basis. Elders agreed to provide videoed interviews and were given honoraria as a thank you for their participation. Smythe asked the Elders what scientists could do to help the community, what stories can be used, where students and educators could work in the community to avoid intruding on sacred sites, and what information should not be made public. Once Elders agreed to provide interviews and share stories, other community members began to speak about their lives and concerns. This included influence of boarding schools, Iife as it was in the past, and changes they would like to see within the community. This was a significant breakthrough.
Table l . Lessons Learned: ten things to consider when developing a science program with Native communities
1. Persistence is key.
2. Face to-face communication is vital and Lakes time.
3. A community advocate with influence and respect in the community is critical.
4. Consult with the Elders first. They have their finger on the pulse of the community and are the center “of the communication network. Nothing happens without their approval. Find out what it is okay to talk about and where your boundaries are and abide by them. lnclude funds for honorariums in your proposal. Elders’ time and knowledge is valuable and they should be compensated as experts.
5. Partner with individuals or groups, such as the Department of Natural Resources.
6. Find a relevant topic. Be flexible with your curriculum choice. It must reflect the needs and interests of the community and the abilities of the teacher you are working with.
7 . Be prepared, bring supplies with you. Ship items in advance if going to a remote location
8. Have the ability to provide individual instruction for students who need it to prepare projects and practice giving presentations.
9. lnvolve the community. Hold events in a community center to encourage everyone to attend.
10. View your involvement as a long-term investment in a committed community relationship.
 ln addition to the Elders, support was needed from a natural resources representative who functioned as a liaison between our group and the community members. This person’s role is found in most villages and could be the head of the Department of Natural Resources or a similar tribal agency that oversees fish, wildlife, and natural resources. This person provides a critical link between the natural environment and the community. The next step is to go in the field with the natural resources representative, science teachers, EIders, and interested students to identify a meaningful focus for the community. lnitially we focused the project with a scientist’s view of teaching microbiology and geology of mineral deposition in a river ecosystem. However, the team found community interest low and no enthusiasm for this project.
Upon our return to the village, the team and CMOP educators found the focus, almost by accident. We were intrigued by “boil water” notices posted both at the home in which we were staying and on the drinking fountains at the school: The students were all talking about water, as were the Elders. It was clear that the community cared about their water quality. The resulting community-inspired research educational plan was based on using aquatic invertebrate bioindicators as predictors of water quality (Adams, Vaughan & Hoffman Black, 2003). This student project combined science with community needs (Bueno Watts, 2011).
CURRICULUM LESSONS
The first classroom lessons addressed water cycle and watershed concepts (Wolftree, 2OO4), which were followed by a field lesson on aquatic invertebrates. Students sampled different locations in an effort to determine biodiversity and quantity of macroinvertebrates. While students were sitting at the river’s edge, the site was described in the students’ Alaska Native tongue by a cultural expert, and then an English translation was provided. This introduced the combination of culture and language into the science lesson.
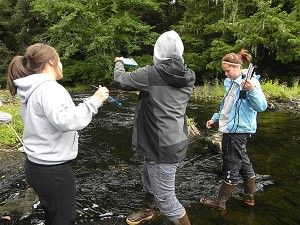 Figure 2: Students use data loggers to collect data on temperature, pH, and location.
The village water supply comes from a river that runs through the heart of the community. Thus, this river was our primary field site from which students collected water for chemical sampling and aquatic invertebrates using D-loop nets. Physical and chemical parameters of the river were collected using Vernier LabQuest hand-held data loggers. Students recorded data on turbidity, flow rate, temperature, pH, and pinpointed locations using CPS coordinates (Figure 2].
 Aquatic invertebrate samples were sorted, classified, counted, recorded, and examined through stereoscopes back in the classroom. Water chemistry was determined by kits that measured concentrations of alkalinity, dissolved oxygen, iron, nitrate/nitrite, dissolved carbon dioxide, and phosphate.
Microbiology assessments were conducted in an effort to detect fecal coliform (using m_FC Agar plates). Students tested water from an estuary, river, drinking fountain, and toilet. Results from estuarine waters showed a high number of fecal coliform, indicating that a more thorough investigation was warranted While fecal coliform are non-disease causing microorganisms, they originate in the intestinal tract, the same place as disease causing bacteria, and so their presence is a bioindicator of the presence of human or animal wastes (Figure 3).
 Students learned that the “dirty water” they observed in the river was actually the result of a natural process of acidic muskeg fluids dissolving iron minerals in the bedrock, no health danger. The real health threat was in the estuarine shellfish waters. Students shared all of their results with their families, after which community members began to approach the CMOP science team with questions about the quality of their drinking water. The community was relieved to find that the combined results of aquatic invertebrate counts and water chemistry indicated that the water flowing through their town was healthy. However they were concerned about the potential contamination as indicated by fecal coliform counts in the local estuary where shellfish were traditionally harvested.
ln the second year, a curriculum on oceanography developed by another STC, the Center for Microbial Oceanography: Research and Education (C-MORE) was introduced (Bruno, Wiener, Kimura & Kimura, 2011). Oceanography lessons focused on water density as a function of salinity and temperature, ocean currents, phytoplankton, and ocean acidification, all areas of research at CMOP. Additional lessons used local shipworms, a burrowing mollusk known to the community, as a marine bioindicator (CMOP Education, 2013). Students continued to conduct bioassessments of local rivers and coastal marine waters.
 Figure 3: Students sort and count aquatic invertebrates as a bioindicator of river health.
Students used teleconferencing technology to participate in scanning electron microscope (SEM) session with a scientist in Oregon who had their samples of aquatic invertebrates. Students showcased their experiments during parent day. Five students (l0%) had parents and/or siblings who attended the event.
SHARING KNOWLEDGE
As a reward for participation in the science program, two students were chosen to attend the American lndian Science and Engineering Society (AISES) 2009 conference in Oregon. Travel expenses were shared between the school, CSC program, and the tribe. ln the following three years an additional ten students attended the AISES conference and presented seven science research posters in New Mexico. Minnesota and Alaska. ln 2012, one student won 3rd place for her shipworm poster presentation (Figure 5). These conference presentations enabled some students to take their first trip out of Alaska.
ln May 20ll the first Science Symposium for grades K-12 allowed students to share their science projects with parents, Elders, and tribal community members. Both students and teachers were prepared on how to do a science fair project. Work with students had to be accomplished on a one-on-one basis, and members of the team were paired with students to assist with completing projects and polishing presentations. Students were not accustomed to speaking publicly, so this practice was a critical step.
The event was held at the local community center, which encouraged Elders and other community members to attend.
Elders requested a public education opportunity to teach the community about watersheds and the effects of logging. Our team incorporated this request into the science symposium. Students led this project by constructing a 5D model of the watershed for display. People could simulate rainfall, see how land use affects runoff and make runoff to river estuary connections. Scientists conducted hands-on demonstrations related to shipworms, local geology, ocean acidification and deepsea research. Language and culture booths were also included. During the symposium, a video of one of the interviews we had conducted with an Elder was shown as a memorial to his passing. The symposium was considered a huge success and was attended by 35 students and 50 community members.
 COMMUNITY RESPONSE
The CSC program garnered results that could not have been predicted at the outset. For example, the tribe requested our input when deciding which students should attend a tribal leadership conference and summer camp. Three student interns participated in a collaborative project with the tribe to conduct bio-assessment studies of local rivers and a key sockeye breeding lake. lnterns operated a remotely operated underwater vehicle (ROV) for data collection, resulting in video documentation of the salmon habitat. ln addition to the bio-assessment, the interns conducted interviews with Elders about the rivers in the monitoring project. The results of this study were used to stop logging around sockeye spawning habitat and to ban the harvest of shellfish from contaminated parts of the estuary. Now the tribe is monitoring rivers on its own. ln the near future CMOP plans to install a sensor that can be monitored remotely, and to train people to read and interpret the data.
CONCLUSION
Community-inspired research often produces a ripple effect of unforeseen results. ln this case, inclusion of Elders in the design and implementation of the project produced large scale buy-in from community members at all age levels. Consequently, in a village where traditionally students did not think about education beyond high school, we have had two students attend college, two students attend trade school, five students receive scholarships, and eight Native interns conducting science or science education in the community. And, given the low numbers of Alaska Natives pursuing careers in science, we find those numbers to be remarkable.
REFERENCES
Adams, J., Vaughan, M., & Hoffman Black, S. (200i). Stream Bugs as Biomonitors: A Guide to Pacific Northwest Macroinvertebrate Monitoring and Identification. The Xerces Society. Available from: http://www.xerces.org/identification-guides/#
Bruno, B. C., Wiener, C., Kimura, A., & Kimura, R. (2011). Ocean FEST: Families exploring science together. Journal of Geoscience Education, 59, 132.1.
Bueno Watts, N. (20,1 1). Broadening the participation of Native Americans in Earth Science. (Doctoral dissertation).
Retrieved from Pro-Quest. UMI Number: 3466860. URL http ://repository.asu.edu/items / 9 438
Center for Coastal Margin Observation & Prediction. QO13). Shipworm lesson URL http://www.stccmop”org/ education/k1 2/geoscience/shipworms
Carza, D. (200.l). Alaska Natives assessing the health of their environment. lnt J Circumpolar Health. 6O@):a79-g6.
Creen, V., Bueno Watts, N., Wegner, K., Thompson, M., Johnson, A., Peterson, T., & Baptista, A. (201i). Coastal Margin Science and Education in the Era of Collaboratories. Current: The Journal of Marine Education. 28(3).
Hall, M. (2000). Facilitating a Natural Way: The Native American Approach to Education. Creating o Community of Learners: Using the Teacher os Facilitator Model. National Dropout Prevention Center. URL http://www. n iylp.org/articles/Facilitating-a-Natural-Way.pdf
Wolftree, lnc. (200a). Ecology Field Cuide: A Cuide to Wolftree’s Watershed Science Education Program, 5th Edition. Beavercreek, OR: Wolftree, lnc. URL http://www. beoutside.org/PUBLICATIONS/EFCEnglish.pdf
ADDITIONAL RESOURCES
The educational resources of CMOP are available on their website : U R L http ://www. stccm o p. o rg / education / kl 2
ACKNOWLEDGMENTS
CMOP is funded by NSF through cooperative agreement OCE- 0424602. Smythe was also supported by NSF grant CEO-I034611. We would like to thank Dr. Margo Haygood, Carolyn Sheehan, and Meghan Betcher for their assistance and guidance with the shipworm project. We would like to thank the Elders and HCA for their guidance, advice and encouragement throughout this program
Nievita Bueno Watts, Pn.D. is a geologist, science educator, and Director of Academic programs at the NSF Science and Technology Center for Coastal Margin Observation & Prediction (CMOP). She conducts research on broadening the participation of underrepresented minorities in the sciences and serves on the Board of Directors of the Geoscience Alliance, a national organization dedicated to building pathways for Native American participation in the Earth Sciences.
Wendy F. Smythe is an Alaska Native from the Haida tribe and a Ph.D. candidate at the NSF Science and Technology Center for Coastal Margin Observation & Prediction. She runs a geoscience education program within her tribal community in Southeast Alaska focused on the incorporation of Traditional Knowledge into STEM disciplines.

by editor | Jul 21, 2014 | K-12 Classroom Resources
Climate Change Education
SWEet!: Using Cascade Snowpack to Teach Climate Change
by Padraic Quinn, Rachel Carson Environmental Middle School
Padraic_Quinn@beaverton.k12.or.us
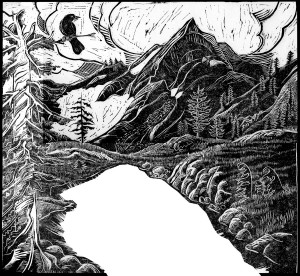
Illustration by Bill Reiswig
Three years ago I was given the opportunity to learn with the scientific leaders of climate change research as part of a teacher-research partnership through NASA, Oregon State University and the Oregon Natural Resources Education Program (ONREP). I heard scientists talk about how forests act as carbon sinks or carbon sources, how LANDSAT data are showing us changes to our landscape, how ocean currents are affecting the availability of copepods eaten by salmon, and how the growth rings in the ear bone of a fish can be studied and correlated with the growth rings of trees on the nearby coast. All of these researchers were making discoveries that played a role in our knowledge of climate change. In addition, teachers were assigned to a scientist each year to conduct research over a two-week period. This allowed both the teachers and researchers to discuss their work and determine ways that it could be transferred from climate researcher work to middle school student work. This sharing of information included access to the scientists and their work, even when I returned to my classroom.
Transferring Professional Development to the Classroom
A significant portion of my classroom science curriculum is spent on independent research projects where students work through the inquiry process to answer a question to a problem on a science topic of their choice. Prior to starting our projects this year I assessed students on their graphing and analysis skills by teaching lessons on climate change in the Northwest, primarily using the Natural Resources Conservation Service (NRCS) SNOTEL system. This automated system, under the technical guidance of the National Water and Climate Center (NWCC) provides snowpack and climate data in the Western U.S. and Alaska. SNOTEL provides real-time data that is critical for understanding future water supplies and allows my students exposure to natural resource issues that will directly affect them and their families. Based on my experiences working with snow pack research, I designed a multiday lesson on climate change that used SNOTEL data to form the basis of the students’ inquiry.
Climate Change and NW Snowpack Lessons
Day 1
Each student was asked to build a concept map for climate change showing connections among different components. Examples were given for a concept we had just finished studying (photosynthesis) so they were clear on how to see and depict interactions. The concept maps varied drastically, partially due to the fact that my classes include a mix of 6 – 8 graders but also because of the wide range of knowledge about climate change knowledge among my students. The discussion after the students completed their concept map and pretest was valuable, with many students wanting to share, ask questions and verbalize their current understanding of climate change.
Day 2
Students were excited when they sat down, and I was in the back of the room with a very loud snow-cone machine. After they got over the initial disappointment of not getting a refreshing snow-cone, each table group was asked to agree on the volume of “snow” that was in the beaker I had filled and placed on their table. Students recorded their information along with a definition of SWE or Snow Water Equivalent. Our basic definition was the amount of water in the snow. Students also made a prediction of the SWE for the “snow” that was on their table. At the end of class, after melting, students determined the percent water content in their snow.
To show a real life example on a large scale of global climate change and melting I had students watch the TED Talk, “James Balog: Time-lapse proof of extreme ice loss”. Balog shows photographs from the Extreme Ice Survey that he began in 2005 and shared in his TED Talk from 2009. Students were asked to write down new information, “WOW” information and questions they had from the talk. Connections were made since some students had been to Alaska, while others had been in the Cascades Mountains; but the majority of the students did not realize that glaciers were present in the mountains located just 65 miles from where they were sitting in Beaverton, Oregon.
Days 3 & 4
To help connect students to their surroundings I had them pick an Oregon SNOTEL site out of a hat. The sites didn’t make sense to them yet but the names are intriguing with the likes of Jump Off Joe, Blazed Alder, Bear Grass and Mud Ridge. Students went online to gather general information about their SNOTEL site such as county, latitude-longitude, and elevation. The students also collected SWE, snow depth, YTD precipitation, and Max., Min. and Average Temperature (see attached student activity sheet). To get a view of the historical context of how SWE has changed over time students collected mean SWE for March in every year that SNOTEL data have been collected. In most cases this was approximately 1978. Students found wide variations in SWE from year to year but soon were asking about specific years from other sites and realized how data were similar from site to site. Many discussions revolved around why such large fluctuations exist, trends over time, temperature’s impact on SWE and elevation impact on SWE. These discussions were difficult for even some of the more accomplished 8th graders, but interest did not diminish due to complexity. Students graphed data, wrote a short analysis and compared data with another student whose site elevation differed (+/-2000’) from their own site.
Adopt-a-SNOTEL site: Long Term Snowpack & Water Availability Activities
As a follow-up to this activity students have been monitoring their SNOTEL sites since November daily for SWE, snow depth, YTD Precipitation and Observed Temperature. (See attached student monitoring sheet.) This work has continued to keep students interested and active in local mountain snowfall and their own SNOTEL site. Each month I am asking students to conduct activities and answer questions on their SNOTEL data. This includes graphing one or more of the parameters, discussing monthly trends in the data, comparing site data with another student and finding sciences article related to snowpack, glaciers and climate change. Students will conduct this activity throughout the winter and spring months as a way to continue their learning on climate change, make a connection to their sense of place and better understand how their water supply will be affected in the short and long term.
The range of benefits to me and my students provided by the Researcher-Teacher Partnerships project have been immeasurable. I have been given open access to an elite scientific community, the collaboration among educators has been inspiring, and my current and future students will continue to learn as researchers.
References
Natural Resources Conservation Service. (2013) SNOTELand Snow Survey & Water Supply Forecasting Brochure. National Weather and Climate Center, Portland, Oregon
http://www.wcc.nrcs.usda.gov/snow/about.html
Natural Resources Conservation Service SNOTEL Data, http://www.wcc.nrcs.usda.gov/snow/
TED Conferences, LLC. (2009) James Balog: Time-lapse proof of extreme ice loss http://www.ted.com/talks/james_balog_time_lapse_proof_of_extreme_ice_loss.html
Science expertise was provided by the following Oregon State University Faculty: Dr. Anne Nolin – Professor and Travis Roth-Doctoral Student in the College of Earth, Ocean, and Atmospheric Sciences
Acknowledgements
These lessons were created using information learned in the Oregon Natural Resources Education Program’s Researcher Teacher Partnerships: Making global climate change relevant in the classroom project. This project was supported by a NASA Innovations in Climate Education award (NNXI0AT82A).
Student Activity Sheet Attached
SNOTEL Activity for Oregon.docx
SNOTEL MONITORING SHEET.docx
SNOTEL SWE for Oregon name: _______________________
SITE MONITORING
Use this to record data for your SNOTEL site for the next month. In the table below you will find the information you will need to record for your site. This should be collected at least once per week for each day that week.
1. Go to Google Search and type Oregon SNOTEL
2. Click on first site shown which will be a map of Oregon
3. Use the drop down menu Select a SNOTEL Site to find your site by name. Or if you know where your site is located you can click on the correct red dot on the map.
Site Name: ____________________________________ Site Number: ___________________________
County: _______________________________________ Elevation: _______________________________
Latitude: _____________________________________ Longitude: _______________________________
5. Click on Last 7 Days under the Daily column for Snow Water Equivalent. Record the following.
| Date |
Snow Water
Equivalent
(in) |
Snow
Depth
(in) |
Year-to-Date
Precipitation
(in) |
Observed
Temp
(degF) |
by editor | Jun 13, 2014 | Forest Education
The LitTER Project: A field method for using litter-fall to study carbon cycling
by Lee Cain & Nick Baisley
Astoria High School Science Department
ABSTRACT
During a NASA funded Teacher-Researcher Partnership program focused on bringing Global Warming and Climate Change into the classroom, a long-term ecological study was created to get students into the field to research leaf litter fall as it relates to the carbon cycle.
Through photosynthesis, carbon in the atmosphere is converted into plant matter, which then will fall to the ground as it continues to be recycled in the carbon cycle. Our investigation is designed to answer the following question: “What is the rate at which carbon as leaf litter moves from a coniferous forest canopy to the forest floor (C-flux as Mg/ha/yr)?” A secondary question we are hoping to answer with this study is: “How does the rate of C-flux relate to coniferous age and management techniques?”
For comparison we selected one 60+ yr. old stand, a 30-50 yr. old recently thinned stand, and a young closed-canopy regenerating clearcut (15-20 yrs. old). In each stand we laid out two parallel transects, each with nine litter traps (plots) spaced 10 meters apart. Along each transect we also placed a HOBO temperature and light data logger.
We are collecting, drying, sorting, and finding the mass of leaf litter, and other sources of carbon, that have fallen into the traps. With only one fully completed set of data, we have yet to begin to answer the key questions of this study. We foresee a period of at least five years before we gather a significant data base. The purpose of this preliminary year was to choose our sites, establish transects, and work through any logistical or methodological challenges that present themselves. In the fall, students will begin taking regular field trips to the sites in order to collect and analyze the data.
 ig forests, big trees. Steep slopes, moss, and mycorrhizal strands of hyphae exposed under sliding boots. Climb up the slope, scramble down the log, lay the tape out, and spread the calipers. Then back up the slope again over the crisscrossed giant pick-up sticks to get the next measurement.
Later, taking a break for lunch, smashing microscopic biting midges against our sweaty arms, we have the chance to gaze upwards at the giant columns and wonder about what each tree has witnessed in its four or five centuries of existence. Then lunch is over, and it’s time to lay the tape out again.
This goes on day after day. Two science teachers from Astoria High School, we were in the H. J. Andrews Experimental Forest in the Cascade Mountains. This forest is part of the Long Term Ecological Research (LTER) Network, created by the National Science Foundation (NSF) in 1980 to conduct research on ecological issues that can last decades and span huge geographical areas. We were working with Dr. Mark Harmon of Oregon State University’s College of Forestry to take follow-up carbon storage measurements on forest research stands that had not been measured since the ‘70s and ‘80s.
In the following week in the computer lab, we take apart the measurements and put them back together again. On graphs, the data slowly begins to crystallize in our minds. We begin to realize that the carbon cycle is not working in the same time-frame as our short lives. It takes time for change to happen. Perhaps much more time than we have to repair the damage that we have done in a relative blink of an eye.
We now notice forests differently. We see logs in a way we did not before. Or rather, we see their absence. Replanted and managed forests appear to be empty – something is just missing. It is not just a sense of something missing – one can visibly notice the absence. No giant pick-up sticks lying crisscross on the forest floor. Such a void of stored carbon.
Back in the classroom, our challenge was to get students to see the actual carbon cycle as we have, and not just as an abstract diagram in a textbook. Then they might just be able to understand their own role in the cycle. We knew that time would be the enemy, because we never seem to have enough of it. But if we can get them to see the carbon falling, even one leaf at a time, then we will have begun the process. So we came up with the “LitTER Project,” a long-term ecological study (9th grade Integrated Science) of the movement of carbon from the forest canopy to the forest floor as falling leaves (litterfall). We realized it might take 5 years or more before we acquire any really significant database, but hoped that the process of getting kids to actually handle the litterfall would set into motion a greater awareness of the carbon cycle.
Our key investigative question was, “What is the rate at which carbon as leaf litter moves from a coniferous forest canopy to the forest floor (C-flux as Mg/ha/yr)?”
A secondary investigative question was, _“How does the rate of C-flux relate to coniferous age and management techniques?”
METHODS
Litterfall Traps — Three sites were selected within the Astoria area to give a wide range of forest ages and management approaches, yet also to be close enough to the high school to be practically accessible. For comparison we selected one 60+ yr. old stand, a 30-50 yr. old recently thinned stand, and a young closed-canopy regenerating clearcut (15-20 yrs. old).

At each site, two transects were laid out parallel, 20 m apart. All transects were set to have a 360 N orientation to be consistent in terms of solar angle of incidence. Nine litterfall traps (plots) were spaced along each transect at 10 meter plot intervals.
Each litterfall trap consisted of a black plastic rectangular floral tray (43 cm by 43 cm ~0.2 m2) lined with window screen to keep all litterfall from passing through the grid of the floral tray. Two wire surveyor flags were used to anchor through the trap into the forest floor and hold the mesh in place. The fluorescent flags helped to aid finding the traps on later visits. In addition, a surveyor’s ribbon with plot identification was tied to a nearby branch. Each plot was cleared of branches for 1 meter above the center of the trap.

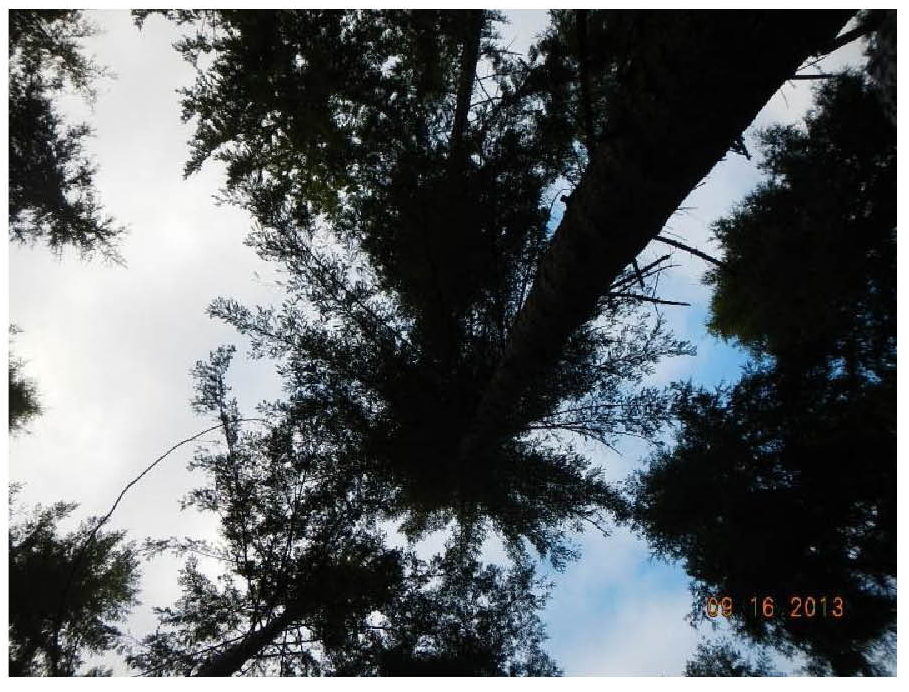
A canopy cover photograph was taken by standing directly over the trap and shooting straight up. A HOBO temperature and light data logger was also placed next to each transect. This photograph can be digitized for percent cover using Photoshop or a similar software. Percent cover can then be used to draw relationships with carbon flux rates.
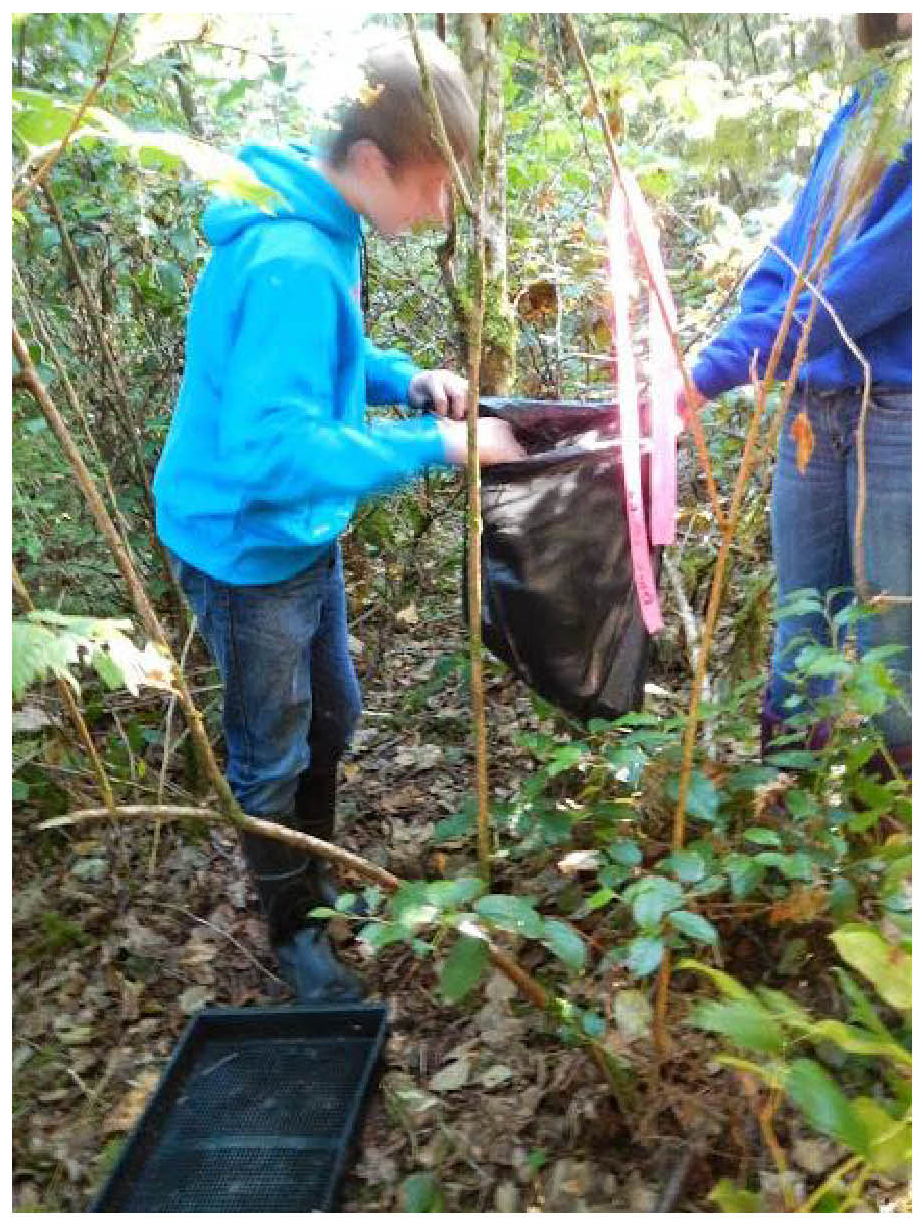
Student Visits — Students were bussed to the study sites and allowed about 1.5 hours to collect the first samples from the traps. Each team of 2-3 students was responsible for collecting the samples from one plot, and re-setting the trap to level and clearing the forest floor to level, flagging the branch above the plot and taking the canopy cover photograph.
Processing Samples — Litter from the traps was placed into black plastic bags labeled with masking tape and trap information. The empty trap was returned to exactly the same position until the next collection date. The bags were tied shut and taken back to the lab, where they were then spread out to dry for two weeks at an average temperature of 25 C. In teams, students then sorted and weighed the litter samples to the nearest 0.1 grams (Table 1) in the following categories: needles, broadleaves, total leaf, woody matter, reproductive (seeds, flowers, etc.), total plant, mineral matter, and animal (bug parts).
GRAPHS AND FIGURES
Table 1 – Teams of students were given single data tables to initially record the sorted raw weights:

Table 2 – Excel was used to summarize the raw data:

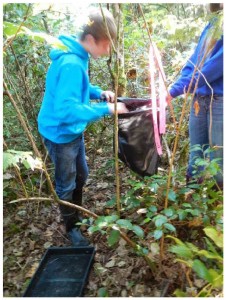
Figure 1 – Graph of summarized results of the first month of data collection:
DISCUSSION
While only one data collection had been completed at the time of publishing, the tables and figures in the previous section should give an idea of how we have arranged the data.
The most obvious result in the data, though it is early yet, is that there are apparently significant differences between study sites in terms of total leaf mass compared to woody matter. Over time, these differences should develop into differences in the rate of carbon flux in the three different systems. This should not be surprising, yet is exactly these sorts of differences that students will likely not be able to see prior to participating in a LitTER project. Because there is only one sample event so far, we have not yet constructed picture of the carbon flux as litterfall over time. What is not known at this time if these differences maintain their relative distances or if it equalizes over time.
 While we are looking forward to pulling out these and other relationships from the data, we are mostly excited by the potential of this project as a tool to get students involved in science inquiry. Students become highly engaged during the data collection and processing. There are also many directions that we can go with the student learning about climate change with this project as a base.
There are still a few areas in the project protocol that we need to revise. Originally, the data collection was planned as a monthly activity that rotated between six Integrated Science classes throughout the school year. But it immediately became apparent that this didn’t work with the busy pace of school and the unforeseen effect of weather (windstorms, rain, snow days).
It is also a major organizational effort to get even one class of student scientists out to the nearest of the sites, let alone bussing six different classes to all of them. To adjust to this, we are now planning on making the data collection quarterly. Three times throughout the year, we teachers will team to collect the data (about 2 hours per site). This approach may eventually fall into the form of a senior project, to be carried out by a capable science-minded individual or group of individuals. Our 9th grade students will now experience the field data collection just once per year, on a fall day devoted to the project. While this is not as ideal as more frequent field trips, we feel that this is a balance we have to make to accommodate the public school setting of our project. At least this way the students have that field experience to help them to better relate when participating in the multiple data analysis events in the laboratory.
REFERENCES
Muller-Landau, H.C. and S.J. Wright. (2010) Litterfall Monitoring Protocol, March 2010 version.
F.S. Peterson, J. Sexton, K. Lajtha. (2013) Scaling litter fall in complex terrain: A study from the western Cascades Range, Oregon. Forest Ecology and Management 306, 118-127 Online publication date: 1-Oct-2013.
This article was submitted for ED 901 – Researcher Teacher Partnerships: Making global climate change relevant in the classroom Spring 2014 ; Oregon State University & Oregon Natural Resources Education Program (ONREP)

by editor | Mar 20, 2014 | Learning Theory
 By Jim Martin
CLEARING Associate Editor
 he young woman carefully pours hydrogen peroxide into a graduated cylinder, presses a key on a computer keyboard, then measures ten drops of liver homogenate into the cylinder. The surface of the hydrogen peroxide seems to leap at the first drop of homogenate, then the drop begins to froth and spin as it is carried deep into the cylinder, trailing a growing, spinning plume of bubbles. Each drop increases the frothing turbulence in the cylinder until it seems enveloped in a pulsing explosion of bubbles. Meanwhile, the young woman’s glance moves from a developing graph on the computer’s monitor to the activity in the cylinder and back again. Science is being done.
If we could see into her mind, what kind of thoughts must we find there? What must she have done and thought to get to where she is at this moment? How will her thoughts change when the reaction has gone to completion and she reviews the data? One thing is certain: this young woman has a history of doing process science. Another thing is certain; her work presents her with conceptual schemata which require filling out with specific facts; the work she does generates a need to know. This need can drive her into the books and the web to find out. Can we capture this kind of science in our classrooms? Can we accommodate her experiences into a model of science pedagogy?
How might this scenario play out in a stream, where the young woman is measuring water quality, collecting and identifying macroinvertebrates, and entering her data into an iPad? Is there any substantial difference in her experiences in the two environments? Certainly there are logistical differences, but I submit that these are an emergent phenomenon which arises from our traditional concept of what school is. Is school a journey of the mind, or is it a place with boundaries, where we learn to pass tests? In both places, she is engaging similar mental concepts, and procedural processes. Our bodies and brains are able to work in both environments. The significant thing is that what the mind and body are doing has to be meaningful. In the case of this young woman, what she is learning is related to what she knows of other knowledge; it is being learned within a familiar context. If she were learning for a test, she would learn the facts, but they wouldn’t necessarily be learned in order to understand. The kind of learning this young woman is engaging is active learning, in which she is constantly comparing her experiences with what she knows. Whether she is consciously aware of it, she has learned how to learn. That’s a powerful skill.
In school, we tend to move from one topic directly to another as if this is what education is about. Many of us do this in our personal world, racing through life, leafing through it as we would a magazine in the doctor’s office, never pausing to contemplate what it is, what it means. We should take the time to absorb life so we can live within it. The same goes for school. Instead of zipping on to the next topic as soon as we’ve covered the current one well enough to test on it, we should probe for students’ attainment of the concepts embedded in the topic to see if they’ve nailed them down. We ought to give students a chance to think about what they’re learning, and design a repeat investigation to nail down their understandings. We need to explore ways to transition what we have just learned to what we will be learning. Even though they can parrot words we’ve used, they may entertain misconceptions and may well not actually understand what we assume they know.
This applies also to teachers. Our pre-service preparation and most of our in-service learning was done with this industrial assembly line model, zipping us through a ritual that eventually placed us at the head of a classroom. About twenty years ago, I was doing a wetlands ecology institute for teachers, and a question came up among the staff about what to do after the teacher participants’ first afternoon in a local wetland. One opinion was, “Okay, they’ve done their first study. Let’s get them ready to go to the coast for their second study.” The other opinion was, “They’ve done what amounts to a casual observation, which might have raised some questions they could follow up with a second investigation.” Fortunately, the second opinion won the day; the participants asked questions which arose as they processed their observations, and they used these to design the following day’s study at the same wetland. Having done that inquiry, once at the coast they hit the beach running, the well-oiled machine, and they nailed down what they had been learning about wetland ecology. It took time, but it moved them further up the learning curve.
After their original casual observation, we could have left them where they were, some in the Acquisition phase, some entering Proficiency. This is what many in-service educators do. We assume the teacher will move to Mastery, but only a few have the self-confidence to do so. Instead, we leave them knowing that they could know, but not ready to take the next few steps. Dryas and I had a mutual friend, who was in late middle-age. Let’s call her Sarah. Sarah had decided to leave an emotionally abusive relationship, but had no idea what to do, nor did she have the confidence to try. A few of us located a place where she could stay, and I agreed to meet with her once a week to help her develop a business plan for using art to explore relationships as a way to earn a living. Over a period of three or four months, we’d meet once a week, and she’d bring out what she’d accomplished on the plan. Her Acquisition phase was long, about six weeks, but then she started accelerating into Proficiency. Sarah had been making collages to express her feelings then interpreting them. This is what she planned to teach others. After moving into Proficiency, each week her collages portrayed a bird, first totally enclosed in a sealed room becoming a bird looking out the window, seeing life outside the window, perched on the window sill, and finally freedom – soaring in the air toward the Sun. The slow but steady movement from locus of control far outside the body, to deep within and freedom to live her life. It takes time, but moves us up the learning curve. We need this in our emotional life, but also in our cognitive, conceptual life.
What’s the difference in insecurity about living in a relationship and insecurity about teaching in a content area? You could leave the relationship because the other isn’t likely to change. But, understanding the science means you’re in a win-win situation, and don’t have to leave, much as you would be in the relationship if the other decided to go into counseling. The young woman pouring hydrogen peroxide obviously understands what she is doing and why. She’ll continue this relationship. That’s what we want.
Are we adrift now? The point is that, like all things we do, they’re done by humans. We bring our small, effective human arsenal to bear on a large number of issues, all manageable with what a well-understood arsenal contains. In school, the secret is your confidence in your capacity to teach, just as in your personal life, the secret is your confidence in your capacity to manage a relationship. Likewise, a student’s confidence in the content and concepts determines her ownership of her learnings. We need to bring them to confidence, then we’re all ready to move to the next topic. How do we do that?
Working with Meredith, the middle-school teacher who takes her class out to the creek at the edge of the school yard, we’ve seen how she has learned to have her students repeat investigations to move along the learning curve. Like a booster rocket, they’ve got altitude and velocity; just need that extra push to get them into orbit. The first time through their work on the creek, they figured out how to do it. Setting up more than one station per group, one at a riffle, at a glide, and at a pool, would ensure students had ample opportunity to move to Mastery. At each trip to the creek, students might repeat their observations more quickly, and could move in to explore new curricula in the time saved. While moving their understanding of, say, macroinvertebrate collection, identification, and interpretation to Mastery, they could be moving their understanding of the roles of the rest of that ecosystem in generating a healthy habitat for the animals they are studying through Acquisition into at least initial Proficiency. That puts Meredith in charge of her curriculum. Which is where she should be; on the road to building competent, empowered minds.
This is a regular feature by CLEARING “master teacher” Jim Martin that explores how environmental educators can help classroom teachers get away from the pressure to teach to the standardized tests,and how teachers can gain the confidence to go into the world outside of their classrooms for a substantial piece of their curricula. See the other installments here, or search Categories for “Jim Martin.”

 This is a regular feature by CLEARING “master teacher” Jim Martin that explores how environmental educators can help classroom teachers get away from the pressure to teach to the standardized tests,and how teachers can gain the confidence to go into the world outside of their classrooms for a substantial piece of their curricula. See the other installments here, or search Categories for “Jim Martin.”