
by editor | Jun 13, 2014 | Indigenous Peoples & Traditional Ecological Knowledge
The Power of One
by Michael J. Caduto
You must be the change you wish to see in the world.
— Mahatma Gandhi
 bout five years ago I started to plan for a new book for children, parents and teachers about global climate change. I soon found that there was no shortage of materials that addressed how humankind is generating greenhouse gases, and explained the myriad ways in which this pollution is changing the weather and impacting people’s lives and environmental health worldwide.
Climate Change on a Kid’s Scale
When I began presenting a related program called Kids’ Power, I encountered a deep-seated concern among many young people who were struggling with this overarching environmental issue. Children’s natural instincts lead them to want to do something about the issues that affect people and the natural world, especially plants and animals, but climate change doesn’t lend itself to clear cut projects like Pennies for Peace or setting up a school-wide recycling program. Some students were vexed by the complexity of climate change; some felt that the issue was so grand they couldn’t take meaningful personal action to help solve the problem; still others saw it as a challenge to meet head-on. One thing was clear: In order for children to know what can be done to solve the problem of climate change, they must have a solid understanding of how our actions affect the environment, as well as what kinds of natural and physical forces can be used to solve the related problems.
The book that was finally published, Catch the Wind, Harness the Sun, explores climate change and includes activities for helping to solve the problem. It then takes a critical step beyond—helping youth to understand the principles behind the forces of nature so that they can harness the power of the sun and wind to generate renewable energy for use in everyday life. To those ends, it covers essential concepts in physics, such as the electromagnetic energy engaged in wind turbines and when pedaling a bicycle generator.
 The Power of One
I also discovered a phenomenon that I call The Power of One: every single positive action taken by each individual adds up to create a huge impact. For example: whenever fortyfive kids convince their parents to replace just one incandescent lightbulb at home with an energy-efficient compact fluorescent light (CFL) or light-emitting diode (LED) bulb, they save more than enough energy to supply all of the lighting for one entire household. If every home in the United States replaced just one incandescent lightbulb with an energy-efficient bulb, it would have the same effect as taking 800,000 cars off the road— reducing greenhouse gas emissions by 9 billion pounds each year. And if each and every household in the United States simply started drying clothes online, instead of using a clothes dryer, we would immediately cut down on the use of enough electricity to shut down thirty average-sized coal-fired power plants. Every action we take to cut down on energy use and generate renewable energy combines with the actions of others to produce a positive synergistic effect.
Green Giants
Still, something else was needed in the book; inspirational stories about young people who have responded to current environmental challenges with projects and programs that are creating a brighter future. These young people come from throughout North America and from such far-flung countries as the United Arab Emirates. Their projects range from the “Cool Coventry Club” (Connecticut) that encourages commitments to reduce energy consumption, generate renewable energy and cut back on greenhouse gases; to anti engine-idling campaigns in Utah and Manitoba; and to generating local hydroelectric power for rural villages in the mountains of Indonesia.
The common element among all of these successful projects is that the children use local resources, harnessed by virtue of their own ingenuity, to make a real contribution toward fighting climate change and other environmental problems. They demonstrate how the solutions are all around us—blowing in the wind, shining down upon us from our home star and flowing through remote mountain streams. These “Green Giants” show that it is possible to (literally) set and run our clocks by using the forces of nature; to create a new world of renewable energy in which fossil fuels (coal, oil and natural gas) will become obsolete.
We adults have left today’s children with a legacy of environmental problems on a global scale. The least we can do is provide them with the knowledge and skills they need, as well as a sense of their own personal power, so that they can understand how to live in balance with the environment today in order to create a sustainable future. Saving our home planet us an exciting, empowering and fun way to connect with other youth in a common cause. Following is an example of how twelve-year-old Adeline Tiffanie Suwana started an environmental movement in Indonesia that has become a powerful force for improving the lives of many people and caring for the natural world.
Friend of Nature
Adeline Tiffanie Suwana
Kelapa Gading Permai, Indonesia
Excerpted from: Catch the Wind, Harness the Sun: 22 Super-Charged Science Projects for Kids. ©2011 by Michael J. Caduto. Used with permission from Storey Publishing.
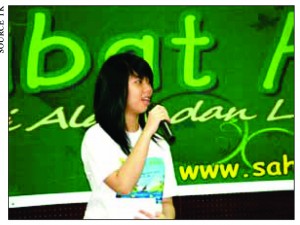
 Adeline was eleven years old and had just graduated from Primary Six in Indonesia when she first got involved with protecting the environment. “I think the most important environmental issue that we face in Indonesia and the world today is Climate Change, which has already disrupted our environment and communities,” she says, “Disasters such as floods, drought, and sinking islands could become more frequent and more severe. Those concerns encouraged me to start asking children to understand, commit and act to save our Earth.”
Many of Indonesia’s low-lying coastal farms would flood if sea levels continue to rise due to global warming. Two thousand of the nation’s smaller islands could be underwater by 2030. Rising temperatures may shorten the rainy season and make storms more severe. These changes would affect Indonesia’s rice yield—the staple food for more than 230 million people.
“Nature is declining in quality at an alarming rate,” Adeline says, “starting from where we live and stretching to the sea—the river, the forest and the air that we breathe. The effects can be felt in the form of floods, air pollution and beach erosion due to climate change and global warming.”
But Adeline is hopeful. Speaking with wisdom beyond her years, she says that, starting at an early age, children need to be encouraged to grow a sense of love and caring toward nature and the environment.
 Planting Trees in a Fragile Land
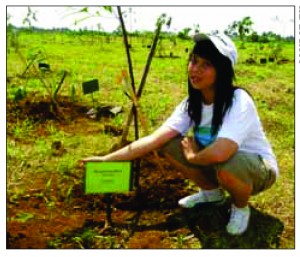
How does an eleven-year-old start to save the world? In July 2008, after graduating from primary school, Adeline spent her holiday teaching friends about the importance of mangrove trees. Soon they were planting mangroves at Taman Wisata Alam Angke Kapuk, the Jakarta Mangrove Rehabilitation Center.
She says that in order for the project to succeed, it was important “to make children include their parents so that they start realizing that it is time that we contribute to the world to save our mother nature from destruction.”
Adeline’s enthusiasm is contagious. She and her colleagues soon formed a group called Sahabat Alam, or “Friends of Nature.” The number of children who joined Sahabat Alam and the environmental projects they took on grew quickly. The group’s activities included ecotourism, planting coral reefs, freeing Penyu Sisik (hawksbill turtles) and cleaning marine debris from beaches.
Several national and international Environmental Organizations have now recognized the work of Sahabat Alam. In May of 2009 Friends of Nature received the Biodiversity Foundation’s (Yayasan Kehati’s) Highest Award and Appreciation in honor of the group’s commitment toward developing awareness among children and youth as the next generation of stewards of Indonesia’s biodiversity.
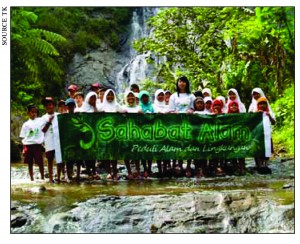 Adeline says she feels honored that she was awarded first place in the 2009 International Young Eco-Hero Awards (for ages eight to thirteen) by the San Francisco-based Action for Nature, a non-profit organization that aims to inspire young people to take action for the environment and protect the natural world in their own neighborhood and around the globe. She was also selected as an Indonesian Delegate by UNEP (United Nation Environment Programme) to participate in the 2009 TUNZA International Children’s Conference in Daejon, Korea in August 2009.
Adeline doesn’t see herself as being much different from any other twelve-year-old. “I am not the only Eco-Hero,” she says. “Children, youths and adults all over the world can do the same thing as long as they have the willingness and commitment. This comes first from the heart, then from sharing with friends and starting to take action.”
 Helping Rural Families
Adeline also sees the connection between the needs of people and the natural world. “I would like to help our remote brothers and sisters to fulfill their dream [of] flowing electricity into their houses for children to study, watch television, cook and all other activities, especially at night.” She is now involved with a program that is bringing electricity into remote areas that have never before had power. She points out that, “Nearly half of Indonesia’s 235 million people live in areas without electricity.”
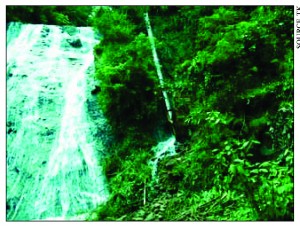
The solution? An Electric Generator Water Reel, a small hydroelectric generator that uses the natural power of a waterfall to produce what Adeline describes as “clean, environmentally friendly, Green, renewable and sustainable energy that does not increase the amount of carbon dioxide in the atmosphere or worsen the greenhouse effect.” The water reel simply turns in the falling water and doesn’t affect the waterfall or the flow of the stream. (See the box called “Reel Math”.)
Sahabat Alam is getting lots of help from parents and sisters, as well as the Indonesian Ministry of Environment. For the first installation, the group traveled to the region of South Cianjur, West Java, which is a four-hour drive from Jakarta. After walking up into the mountains for another two hours, the team finally reached the village of Kampung Cilulumpang. By the time they left, the villagers had electricity for the first time in their lives. The group is now building Electric Generator Water Reels for two other villages, and it plans to bring this project to villagers throughout Indonesia.
“Previously, children’s voices were not heard,” says Adeline, “but now, we are coming together to voice our commitment to our national leaders and world leaders, to make peace and start having one voice to save the Earth.”
“I share and affirm with all of them that, even with our small hands, children can initiate, contribute and implement environmental projects starting from their small community to nation-wide projects to contributing to the world by helping hinder climate change and global warming and save the earth from further destruction.”
“We are the next and future generations of the world. In our hands, the world and its contents are at stake.”

Resources
Adeline Tiffanie Suwana’s Friends of Nature website
Action for Nature
Change the World Kids
Young Voices on Climate Change
YouTube video for Catch the Wind, Harness the Sun
Sources That Explain Global Climate Change:
Tiki the Penguin
Global Warming Question and Answer Web Site, National Oceanic and Atmospheric Administration/
National Environmental Satellite, Data, and Information Service (NESDIS) Asheville, North Carolina
Renewable Energy for Kids:
EcoKids Canada, Earth Day Canada, Toronto, Ontario
Energy Kids, U.S. Energy Information Agency, Washington, D.C.
Curriculum Connections:
The Pembina Institute: Lessons & Activities, Curriculum Links
Natural Resources Canada’s Climate Change Teacher Resources: Grade 5
Michael J. Caduto, author, environmental educator, storyteller and ecologist, is well known as the creator and co-author of the landmark Keepers of the Earth® series and Native American Gardening. He also wrote Pond and Brook and Earth Tales from Around the World. His latest books are Catch the Wind, Harness the Sun: 22 Supercharged Projects for Kids (Storey Publishing) and Riparia’s River (Tilbury House). His many awards include the Aesop Prize, NAPPA Gold Award and the Brimstone Award (National Storytelling Network). Michael’s programs and publications are described on his website: www.p-e-a-c-e.net


by editor | Jun 13, 2014 | Schoolyard Classroom
Starting a Community-based Natural Resource Education Program

Strategies for Authentic Community Engagement
Authors Patrick Willis Oregon State University Extension 4-H Portland, Oregon
Susan Cross Environmental Educator Tucson, Arizona
lmost every school has a natural area very nearby. It could be that marshy place behind the school, the little stream or “ditch”, the unmowed field, or the patch of woods beside the parking lot. These natural areas are often overlooked as learning sites, or if they are recognized, they are not acted upon because we do not know exactly how to start using them. The intent of this article is to provide educators with a platform to begin natural resource programming at sites near their school. Philosophical as well as pragmatic information is shared to provide both intrinsic and conceptual connections for educators to engage youth in authentic community involvement in the natural resources. This information is intended to offer support, ideas, encouragement and new ways to think about what we do as educators. It is meant to inspire you and move you to action.
It is our hope that through programs that link schools with natural resource areas, citizen awareness and community involvement will increase. The vision is for schools to become vital resources for their communities and that students, through real world projects, become active participants in their society.
 Why connecting students with natural resource areas have educational benefits.
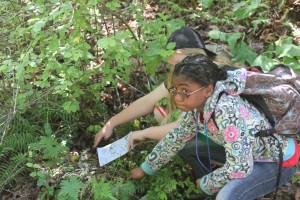
A strong connection to the larger world community starts with an intimate local understanding. Children can apply knowledge of systems and concepts learned in a personal experiential world to global problems. Once they grasp the value and function of the forest, wetland, grassland or watershed in their school backyard, it is a short step to awareness about other watersheds or wetlands that they see in their own community, or to a concern about global environmental issues they hear about in the media. A personal stake in the lives of their wood ducks, red-tailed hawks or metamorphosing moths becomes an intrinsic understanding of the richness present in all ecosystems. A program such as this taps the innate desire of children to care for their world and allows them to do just that: to help, to clean up, to make better homes for wildlife, to gather information to guide decision making. It empowers them at the local level and gives us all a much needed assurance that active informed citizens can and DO make a difference.
Students involved in active hands on programs also feel better about the way they are learning. The students report that they have more fun and feel like they are learning things that they didn’t know before. Teachers say that their students really retain more of what they learn and can apply the learning in other situations.
In these times of being overwhelmed by environmental problems on every front, it is easy for people to lose their sense of hope and to feel defeated in the face of such looming concerns. This can be especially hard on young people, who have been inundated since early childhood with the magnitude of our planet’s problems. Working with young people in settings where they can impact an area in a positive way is a powerful tool to help them realize the healing potential they have as caring human animals.
Getting Started
Many educators find the idea of starting a program such as this to be intimidating…And it can be!! Teachers already have heavy workloads. It often feels as though there isn’t enough time in the day to prepare for classes, grade the day’s papers and still get to eat lunch! The extra work required to implement an on-going, in the field/community program can indeed loom large in the picture and cause many people to give up before they even begin.
 Sites and Site Selection
The initial step is to find a site around which to center your program. The site is an integral part of the program because it becomes the focal point for community involvement. Because of time limitations in our schools, the closer the site is to the school door the better. The site doesn’t need to be huge or elaborate. It can be the little ditch on the school grounds, it could be the marsh on private land across the street, it could be the little patch of forest left in an urban development, it could even be something that you restore or develop on your own school grounds. The ability to visit the site frequently outweighs any lack of “wildness.” In the reality of today’s shrinking school budgets, transportation money is drying up. A site within walking distance solves this problem, and makes all logistics easier.
After you determine what site or sites you may be able to use for your program you will need to find out as much as possible about the site. In an ideal situation, this entire process can be done by your students. You will want to find out who owns the property. Who is in charge of managing it? Can you use the site as a study center? Are there special things about the site? Is it a protected area? How will you minimize the impact of your student’s presence at the site? Get maps of the local area. Talk to homeowners associations and neighborhood businesses. Can you do enhancement work there? How could the site be improved for wildlife or educational uses? What kind of information would it be useful to have about the site? Who might best use that information? What is the history of the site? Are there any cultural values?
When you find out who is involved with your site you may be surprised to learn that those people need your student staff to collect information as much as you need them for their expertise. Some sites may be in private ownership and you may have to seek permission to use the land as a study site. This process in itself can be quite a learning experience for your students. Many schools are lucky enough to have natural areas on their own grounds, but you may still need permits to make changes. Each place has its own unique combination of political circumstances just as each place has its own unique natural character. Let the problems you encounter become learning challenges. Help your students learn about how the world outside the classroom operates. The problems you face will lead to the development of valuable life-long learning skills.
Willingness to Change Attitudes and Structures
Often the success of innovative programs depends on our ability to think in new ways. Change is never easy and is especially hard to create in institutional settings. It is difficult to envision new roles for ourselves and new shapes for our old models. With the momentum for educational change coming from the state level, the atmosphere for programs of this type is good, and you could be on the leading edge of this change. The watchword of the hour is flexibility.
 Changing Teacher Roles
In this kind of program the teachers may have to recreate the way they interact not only with their students but also with their peers and administrators. You may find yourself much more of a coordinator and learning manager than a deliverer of set curriculum. You may find that the most important function you can serve is finding access for your students to partnership opportunities with other adult instructors. You may spend your time locating project ideas, equipment and funds rather than directly teaching lessons. You may need to spend time on the phone coordinating an event or writing proposals to fund your program’s newsletter. It is not the role you are probably most familiar with and it can seem like a leap into the unknown. It can also lead to personal growth and a great deal of fulfillment as your program blossoms.
Changing Educational Models
Everyone involved in education agrees that our current model doesn’t seem to be working. Students are not entering the adult world prepared to meet the challenges of a rapidly changing and complex world. Demand for people who can work cooperatively, be self motivated learners and understand complex systems is growing in every field of endeavor. Schools somehow need to provide their students with opportunities to learn the skills of citizen action, exposing them to processes and systems both natural and social. Students need to have real world experiences with real world consequences. Programs such as this can offer those opportunities. Schools could be in the business of finding community needs that aren’t being met. Schools could become a resource for the community instead of being viewed as a drain on resources. The school, through a program, could provide opportunities for students to interact with their community and society using meaningful projects that need to be accomplished. A great deal of excitement and motivation builds around an idea when students are producing work for a real world audience with a real world purpose. Think of the schools as a pool of highly educated leaders with a large motivated work force that just needs to be focused and applied to the needs of the community!
The Time Issue
Time, or the feeling of never having enough time, is a stumbling block in the initiation of Community-based programs. How much time should be allocated for activities related to the project? How will the teachers involved find time to organize materials, field work and special events? Is one day each month enough field contact? Perhaps one day each week may be needed. How will this program fit in with music, social studies or math? Is a 45 minute period enough time to get out into the field, do a study, and then get back? All these time questions are quite valid and need to be explored. But our attitudes, those hidden assumptions behind our time feelings also need to be explored. How did our school day come to be fragmented into 40-45 minute blocks? Does it have to be that way? Can our scheduling be more flexible without a loss of quality?
Using a thematic or project based approach to interweave your Community-based program into several subject areas can increase the amount of time spent in the field or community. Math can serve to interpret collected field data. Art could be the designing of logos or signs for the site. Music could involve songs written about the area and performed at a school wide celebration. Pursuing permission to have use of a site, or to make changes at a site, could serve as lessons in political science. Keeping journals or producing an informative newsletter is a natural for writing and language.
You Don’t Need to be an Expert
A general fear many educators experience is that they will be asked about something they don’t know. When beginning a program that involves a natural resource area there will be tons of things you don’t know, and that will be part of the excitement. As teachers we have the feeling that we should always be able to answer every question like an expert; but we may want to consider that the “teacher-as-learner” may be a more powerful model than the “teacher-as-dispenser-of-all-knowledge”. Being able (and willing) to say, “I don’t know, but let’s see if we can find out,” is a virtue in an educator, not a sin. Think of the program as an opportunity for you and your students to learn about an ecosystem together. Curiosity, enthusiasm and access to good reference materials are far more important than teachers having all the specific information on a particular environment locked away in their brain.
Program Planning for Administration Support
Having the support of your administrator may allow you to arrange for time to do planning for and coordination of your program. With good administrative support and communication, substitute time may be possible for planning, attending development classes or for special field programming for your students. It is almost impossible for teachers to teach a regular load and to just add on another program. Realistically the teacher who takes on a project of this sort will need time and support from their school. Your formal proposal may give your administrator a powerful tool for acquiring a commitment from your school board or district for that extra time you will need.
Project Plan Outline
Another important part of beginning a program is the time spent early on in the planning phase. If you take the time to examine your hopes and limitations, to determine what your goals are and to commit those to paper, you will have come a very long way toward establishing something concrete to build the program on.
The proposal form (Figure 1) will help you create a document you can use to approach school administrators, fellow staff members, and potential partners. It will help you clarify your group’s goals and priorities. Your proposal form, or “white paper” describes the vision and who should participate, the benefits of participation, and the benefits to the community. In addition, the project plan often contains language very useful in future grant proposals. Whether your project is simple or complex, you and your group will benefit from taking the time to ask yourselves the questions contained in the form.

Community-based Program Strategies
You have a program proposal, you have administration support, there is building enthusiasm for the project…what do you do next? The following are tested and well established examples about how to generate and sustain interest in the program as it develops.
Create an Identity
Your students and others involved in the project will have much more ownership if the site you have chosen has a name or an identity. It is probably more powerful to have the students highly involved in the process of creating an image for the site rather than having an image imposed on them. You will want to guide them in coming up with an attractive logo that can be used on your future newsletters, correspondences, signs and t-shirts. You may want to consider letting people know what your purpose is in the construction of the name. Are you a resource center, a study center, a technology center, or something else? Is there some special plant, animal or geographic feature at your site that would make a good symbol or icon?
 Increase Community Contact
Support for your program will grow if people know about what you are doing. Cultivate a relationship with your local media. Let them know when your students will be out in the field, when you are putting up a sign to identify your site or have special activities planned. Your students can write and publish a website or a simple, informative newsletter about their involvement and successes. Invite partners and potential donors or other influential people in your community to observe what your students are doing. People often like to jump on the bandwagon of an interesting project and partnerships can develop from public knowledge of the program.
Create a Student Leadership Component in Planning
You can plan yourself silly, but if the project doesn’t have student ownership and support your plans will soon sink with apathy or resistance. Students need to feel like it is their program. They need to be active citizens in the process right from the beginning. Having student representation at the planning level will lend legitimacy to tasks proposed for students to accomplish. It can be a powerful growth experience for the students involved.
Spend Some Time on Aesthetics
If you think back to your own interest in the natural world it is usually linked very closely with a sense of place. Allow your students time in their special environment to observe the natural world in a holistic way. Love of the natural world doesn’t come from performing pH tests. It comes from watching spiders build their webs or resting in the sun in tall grasses and listening to a killdeer sing. Set up intentional aesthetic activities for your students early on in the program. You’ll end up with strong advocates for the site. Emotional responses to the environment are not irrational responses; and emotional ties to place are often the best motivations to action!
Approaching Resource People
Depending on your circumstances you may want to use resource people as special advisors or you may want to form partnerships with one or more of them that includes actually working on projects that they are involved with. Resource people as guest speakers in the classroom probably has limited value. If you can arrange for your students and staff members to work directly with resource people it can lead to much larger rewards for everyone. Because most resource people have many duties in their job descriptions, they are busy people. If you can approach them with detailed specific needs and directions about how they might help you with their expertise, their time will be used much more effectively.
Funding Ideas
Money always seems to be a limiting factor in program development, but don’t let a lack of funds discourage you. Many activities can be done without much money. Exploring and getting to know the site, doing plant and animal inventories, making maps, observations of seasonal changes or planning an awareness celebration for the school or community can all be accomplished with a minimum of funds.
Keeping the community and the media aware of your plans and goals can lead to opportunities for donations from businesses such as volunteers, money, equipment or supplies. Parent/Teacher organizations can be a source of funding as well as a source of volunteer helpers. Motivated students can also be excellent fund raisers using all those time proven school fund raising techniques. You and your students may also be able to come up with a product associated with your site such as t-shirts with a logo, wildlife art or photography from the site, or some other product or service. Cities or counties may be able to donate time or materials. Agencies sometimes have funding for plantings or restoration work. Cities and agencies may be able to provide tools and advice from staff people.
There is always the potential for grant writing as a source for funds. This approach to raising money is often available but comes with the fears of how to get started, who to ask, what to say and, of course, finding the time to write the grant. Another factor to consider is the fear of getting the grant. Most granting organizations require you to do what you promised in the grant! This is where your program plan becomes a valuable resource. A good plan is the first step in approaching a funding source. As for who to ask for funding, the list of possibilities can be overwhelming. Start with a few inquiries with local agencies and ask others who have written grants. Most people are very supportive and helpful. If you stay with a reasonable plan, your program will blossom with the assistance of a grant and not degrade into unfulfilled dreams.
 Field Techniques
Many teachers feel uncomfortable taking their students outdoors. It is a much less structured setting and chaos can quickly ensue. A bad field experience can leave a leader longing for those wonderful rows of desks back in the building. Field study does require some special skills and planning, but the harvest you and your students reap is rich!
There are some risks being in the natural world, from twisted ankles to bee stings; but the possible rewards far outweigh the risks. Safety is an important concern in the field. Make sure you have a first aid kit with you and know what to do in an emergency. You may want to check on your school’s insurance policies for field settings. Many risk factors can be greatly reduced by explaining clearly to your students what your expectations are for behaviors in the field.
Setting the same kind of clear behavior expectations for the field as you have in your regular classroom is essential. Let students know that you have boundaries that they must respect, being sure to be clear about what areas are off limits and why. Have set work areas for each group. It is often easier to explain tasks and rules inside the normal classroom setting before you set off into the outdoors to do your field work.
Spending a bit of time on field ethics is a valuable thing. Students don’t automatically know that they need to be quiet, to not disturb plants and animals unnecessarily, or that horseplay is not acceptable. Most of the time when we allow students to be in the out of the classroom is for unstructured play. It takes some training to get the message across that outdoors doesn’t always mean recess.
Group size is another important factor in the success of field work. Small groups function much better than large groups. Have a job for everyone. Having tasks that keep the students focused brings the potential for misbehavior down. If you are the only leader, use a “hub” approach. Have a central location from which you disperse and gather your student work groups. It is also important to realize that not all students need to do everything. Often it is better to have students become the “experts” at a certain job or subject area and to share their findings and knowledge with the others.
Minimize Your Impact/Earth Ethics and Etiquette
One of your most important roles in the program is as a role model for student behavior. Your actions speak much louder than your words and children will treat the environment much the same way that you do. This can be an enormous opportunity to teach outdoor ethics without ever saying a word. Your decisions about collecting, the way you treat plants and animals in the environment, and what your expectations are for your student’s interaction with the site are all powerful messages about how to treat the planet. Children should be engaged in decisions about when, why and how to collect samples. Is it appropriate? Is it necessary? What valuable thing will we learn from the experience? Examine ways in which your visits impact the natural world. Are there ways that we can reduce those impacts and still learn the things we want to? How long lasting are our disturbances? Bringing these kinds of questions into the consciousness of your students will help them to form and examine their own beliefs on these issues.
Conclusion
Change will only come to our systems through the efforts of individuals. Though change is difficult and frightening, it is also empowering and growth producing. It is up to you to try things out, to experiment with ideas and to not be afraid of failure or of success. BE ALERT! This approach to student/citizen involvement can become a self-perpetuating system…a machine that may be difficult to stop once engaged!! Don’t be surprised when you become the center of excited interest emanating from your students, their parents, your colleagues and administrators! We owe it to our students and community to try!
Pat Willis is a distinguished environmental educator currently with Oregon State University Extension 4-H.
Susan Cross is a former EEAO member and Oregonian now living in Arizona.
by editor | Jun 13, 2014 | Forest Education
The LitTER Project: A field method for using litter-fall to study carbon cycling
by Lee Cain & Nick Baisley
Astoria High School Science Department
ABSTRACT
During a NASA funded Teacher-Researcher Partnership program focused on bringing Global Warming and Climate Change into the classroom, a long-term ecological study was created to get students into the field to research leaf litter fall as it relates to the carbon cycle.
Through photosynthesis, carbon in the atmosphere is converted into plant matter, which then will fall to the ground as it continues to be recycled in the carbon cycle. Our investigation is designed to answer the following question: “What is the rate at which carbon as leaf litter moves from a coniferous forest canopy to the forest floor (C-flux as Mg/ha/yr)?” A secondary question we are hoping to answer with this study is: “How does the rate of C-flux relate to coniferous age and management techniques?”
For comparison we selected one 60+ yr. old stand, a 30-50 yr. old recently thinned stand, and a young closed-canopy regenerating clearcut (15-20 yrs. old). In each stand we laid out two parallel transects, each with nine litter traps (plots) spaced 10 meters apart. Along each transect we also placed a HOBO temperature and light data logger.
We are collecting, drying, sorting, and finding the mass of leaf litter, and other sources of carbon, that have fallen into the traps. With only one fully completed set of data, we have yet to begin to answer the key questions of this study. We foresee a period of at least five years before we gather a significant data base. The purpose of this preliminary year was to choose our sites, establish transects, and work through any logistical or methodological challenges that present themselves. In the fall, students will begin taking regular field trips to the sites in order to collect and analyze the data.
 ig forests, big trees. Steep slopes, moss, and mycorrhizal strands of hyphae exposed under sliding boots. Climb up the slope, scramble down the log, lay the tape out, and spread the calipers. Then back up the slope again over the crisscrossed giant pick-up sticks to get the next measurement.
Later, taking a break for lunch, smashing microscopic biting midges against our sweaty arms, we have the chance to gaze upwards at the giant columns and wonder about what each tree has witnessed in its four or five centuries of existence. Then lunch is over, and it’s time to lay the tape out again.
This goes on day after day. Two science teachers from Astoria High School, we were in the H. J. Andrews Experimental Forest in the Cascade Mountains. This forest is part of the Long Term Ecological Research (LTER) Network, created by the National Science Foundation (NSF) in 1980 to conduct research on ecological issues that can last decades and span huge geographical areas. We were working with Dr. Mark Harmon of Oregon State University’s College of Forestry to take follow-up carbon storage measurements on forest research stands that had not been measured since the ‘70s and ‘80s.
In the following week in the computer lab, we take apart the measurements and put them back together again. On graphs, the data slowly begins to crystallize in our minds. We begin to realize that the carbon cycle is not working in the same time-frame as our short lives. It takes time for change to happen. Perhaps much more time than we have to repair the damage that we have done in a relative blink of an eye.
We now notice forests differently. We see logs in a way we did not before. Or rather, we see their absence. Replanted and managed forests appear to be empty – something is just missing. It is not just a sense of something missing – one can visibly notice the absence. No giant pick-up sticks lying crisscross on the forest floor. Such a void of stored carbon.
Back in the classroom, our challenge was to get students to see the actual carbon cycle as we have, and not just as an abstract diagram in a textbook. Then they might just be able to understand their own role in the cycle. We knew that time would be the enemy, because we never seem to have enough of it. But if we can get them to see the carbon falling, even one leaf at a time, then we will have begun the process. So we came up with the “LitTER Project,” a long-term ecological study (9th grade Integrated Science) of the movement of carbon from the forest canopy to the forest floor as falling leaves (litterfall). We realized it might take 5 years or more before we acquire any really significant database, but hoped that the process of getting kids to actually handle the litterfall would set into motion a greater awareness of the carbon cycle.
Our key investigative question was, “What is the rate at which carbon as leaf litter moves from a coniferous forest canopy to the forest floor (C-flux as Mg/ha/yr)?”
A secondary investigative question was, _“How does the rate of C-flux relate to coniferous age and management techniques?”
METHODS
Litterfall Traps — Three sites were selected within the Astoria area to give a wide range of forest ages and management approaches, yet also to be close enough to the high school to be practically accessible. For comparison we selected one 60+ yr. old stand, a 30-50 yr. old recently thinned stand, and a young closed-canopy regenerating clearcut (15-20 yrs. old).

At each site, two transects were laid out parallel, 20 m apart. All transects were set to have a 360 N orientation to be consistent in terms of solar angle of incidence. Nine litterfall traps (plots) were spaced along each transect at 10 meter plot intervals.
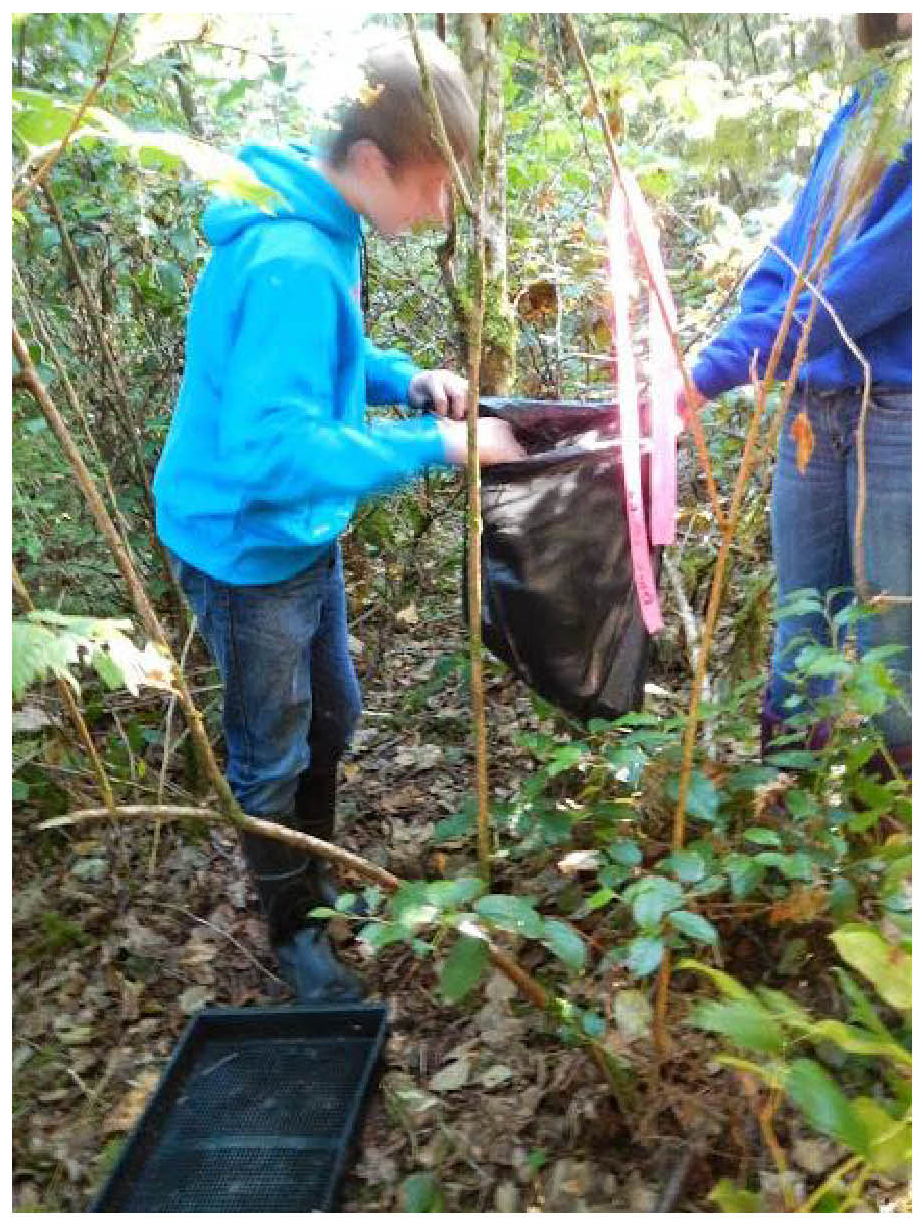
Each litterfall trap consisted of a black plastic rectangular floral tray (43 cm by 43 cm ~0.2 m2) lined with window screen to keep all litterfall from passing through the grid of the floral tray. Two wire surveyor flags were used to anchor through the trap into the forest floor and hold the mesh in place. The fluorescent flags helped to aid finding the traps on later visits. In addition, a surveyor’s ribbon with plot identification was tied to a nearby branch. Each plot was cleared of branches for 1 meter above the center of the trap.

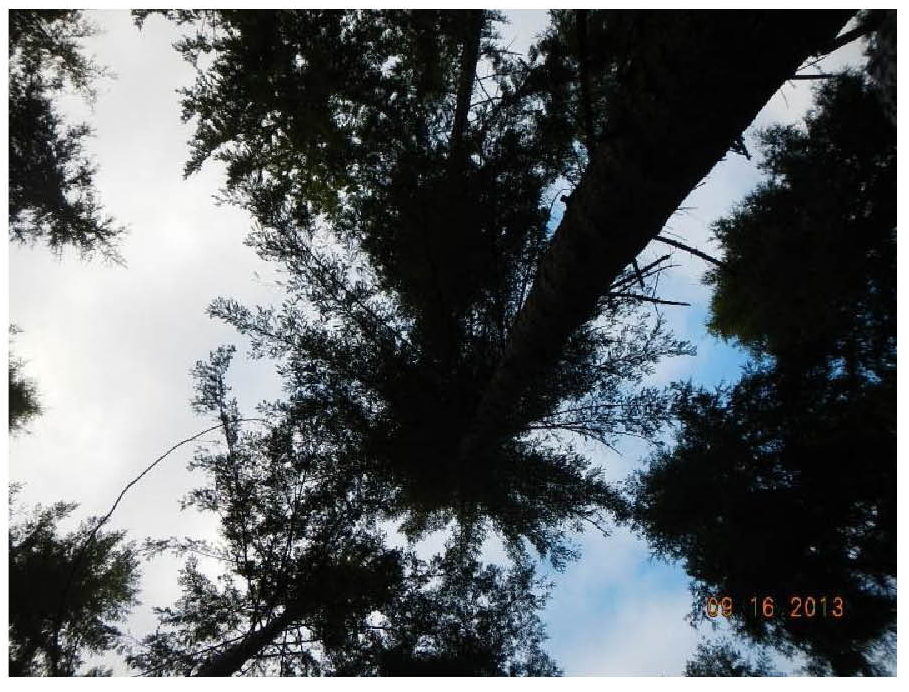
A canopy cover photograph was taken by standing directly over the trap and shooting straight up. A HOBO temperature and light data logger was also placed next to each transect. This photograph can be digitized for percent cover using Photoshop or a similar software. Percent cover can then be used to draw relationships with carbon flux rates.
Student Visits — Students were bussed to the study sites and allowed about 1.5 hours to collect the first samples from the traps. Each team of 2-3 students was responsible for collecting the samples from one plot, and re-setting the trap to level and clearing the forest floor to level, flagging the branch above the plot and taking the canopy cover photograph.
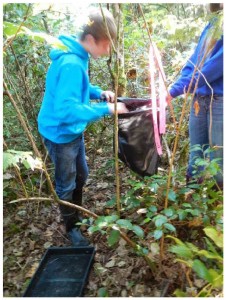
Processing Samples — Litter from the traps was placed into black plastic bags labeled with masking tape and trap information. The empty trap was returned to exactly the same position until the next collection date. The bags were tied shut and taken back to the lab, where they were then spread out to dry for two weeks at an average temperature of 25 C. In teams, students then sorted and weighed the litter samples to the nearest 0.1 grams (Table 1) in the following categories: needles, broadleaves, total leaf, woody matter, reproductive (seeds, flowers, etc.), total plant, mineral matter, and animal (bug parts).
GRAPHS AND FIGURES
Table 1 – Teams of students were given single data tables to initially record the sorted raw weights:

Table 2 – Excel was used to summarize the raw data:

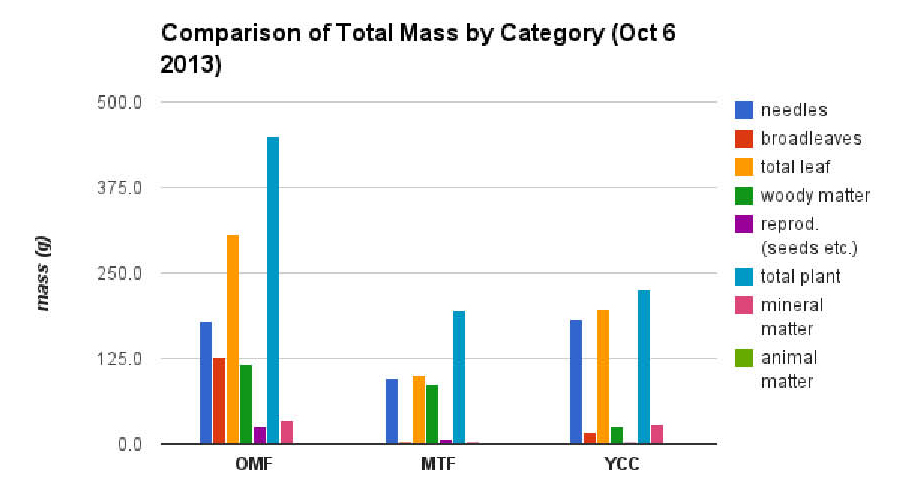
Figure 1 – Graph of summarized results of the first month of data collection:
DISCUSSION
While only one data collection had been completed at the time of publishing, the tables and figures in the previous section should give an idea of how we have arranged the data.
The most obvious result in the data, though it is early yet, is that there are apparently significant differences between study sites in terms of total leaf mass compared to woody matter. Over time, these differences should develop into differences in the rate of carbon flux in the three different systems. This should not be surprising, yet is exactly these sorts of differences that students will likely not be able to see prior to participating in a LitTER project. Because there is only one sample event so far, we have not yet constructed picture of the carbon flux as litterfall over time. What is not known at this time if these differences maintain their relative distances or if it equalizes over time.
 While we are looking forward to pulling out these and other relationships from the data, we are mostly excited by the potential of this project as a tool to get students involved in science inquiry. Students become highly engaged during the data collection and processing. There are also many directions that we can go with the student learning about climate change with this project as a base.
There are still a few areas in the project protocol that we need to revise. Originally, the data collection was planned as a monthly activity that rotated between six Integrated Science classes throughout the school year. But it immediately became apparent that this didn’t work with the busy pace of school and the unforeseen effect of weather (windstorms, rain, snow days).
It is also a major organizational effort to get even one class of student scientists out to the nearest of the sites, let alone bussing six different classes to all of them. To adjust to this, we are now planning on making the data collection quarterly. Three times throughout the year, we teachers will team to collect the data (about 2 hours per site). This approach may eventually fall into the form of a senior project, to be carried out by a capable science-minded individual or group of individuals. Our 9th grade students will now experience the field data collection just once per year, on a fall day devoted to the project. While this is not as ideal as more frequent field trips, we feel that this is a balance we have to make to accommodate the public school setting of our project. At least this way the students have that field experience to help them to better relate when participating in the multiple data analysis events in the laboratory.
REFERENCES
Muller-Landau, H.C. and S.J. Wright. (2010) Litterfall Monitoring Protocol, March 2010 version.
F.S. Peterson, J. Sexton, K. Lajtha. (2013) Scaling litter fall in complex terrain: A study from the western Cascades Range, Oregon. Forest Ecology and Management 306, 118-127 Online publication date: 1-Oct-2013.
This article was submitted for ED 901 – Researcher Teacher Partnerships: Making global climate change relevant in the classroom Spring 2014 ; Oregon State University & Oregon Natural Resources Education Program (ONREP)
by editor | Jun 12, 2014 | Place-based Education
10 Questions to Ask When Developing Place-based Learning Experiences

by Gregory Smith, Professor of Education, Lewis & Clark College
 he March 19, 2014 Oregonian included an article about two math teachers at Benson High School in Portland who have created a course they call Tech Geometry that requires students to apply their emerging mathematical understandings to projects that have social value. They combine work in the classroom with work in a spacious auto shop where they use what they’ve learned about triangles, the Pythagorean theorem, or trigonometric functions to design and construct a 120-foot structure for the otherwise homeless residents of Portland’s Dignity Village or a playhouse for Escuela-Viva, a nearby bilingual preschool.
The class is an example of place- and community-based education. This approach to teaching and learning involves finding ways to give young people a chance to use their emerging academic knowledge and skills to make positive contributions to their community. The result is almost always engaged students, energized teachers, and enthusiastic community members. Learning becomes meaningful as the boundaries between classroom and the world beyond are reduced, students understand the value of what they’re learning, and tax-paying citizens come to see public school as an institution that gives back as well as takes.
Developing lessons or units that incorporate these possibilities can serve as an important motivation for student learning. Even with today’s emphasis on instruction driven by standards and tests, teachers in school districts around the United States and other countries are finding ways to integrate opportunities for applied learning outside the classroom into their work with students. Teachers successful in moving in this direction start small with projects that easily connect to curriculum requirements and have a strong likelihood of success. To guide their efforts, they often consider the following questions:
1. What local topics, issues, or projects are likely to be meaningful for students and give them an opportunity to participate in learning activities that others will value?
2. What aspects of the required curriculum are related to this issue or project? List specific subtopics that students might explore, including those related to other subject areas.
3. What four or five overarching questions might guide your students’ study?
4. What specific learning standards would this topic or project enable you to address?
5. How will you assess student learning? List possible strategies, including some culminating projects. Discuss how you will scaffold the learning that students need.
6. What community partners might you bring into the classroom to help teach this unit or to support activities outside of school?
7. What field studies, monitoring, or other inquiry activities might students become involved with in their neighborhood, community, or region?
8. What community needs might students address as part of this unit or project? What service learning opportunities does it afford? How might you publicize the contributions that students make?
9. How might students become involved in community governance activities related to this project? How could they participate in data gathering, reporting, or other forms of public participation, such as organizing meetings or planning community events?
10. What creative possibilities in the fields of art, music, dance, film, or theater relate to this project? What about vocational opportunities or internships?
More than anything, implementing place- and community-based education requires a shift of perspective and the willingness to see learning opportunities in something other than textbooks, computer programs, or laboratory experiments whose end results are already known. By approaching the world beyond the school as a text filled with potential resources and needs, teachers can bring to their students the kinds of learning experiences that once lay at the heart of cultural transmission in earlier human societies, experiences that gave young people the chance to develop valued competencies and to perceive themselves as people able to contribute to the well-being of their community. When this happens, learning becomes not a chore but a means for realizing one’s identity and ability to make a positive difference in the lives of others.
Gregory Smith is a Professor Emeritus of Education at Lewis & Clark College in Portland, Oregon. Contact him at gasmith@lclark.edu
This article originally appeared in TOST, the journal of the Oregon Science Teachers Association, June 2014.
Addendum:
Place-Based Education Northwest was formed following a suggestion from a participant at a two-day workshop about this educational approach in November, 2005. Its primary purpose has been to serve as a meeting place for people interested in making room for local knowledge and learning experiences in regional schools. The organization now meets twice-yearly in early December and May at Lewis & Clark College in Portland, Oregon. These gatherings have provided an opportunity for local educators who have adopted place-based approaches to share what they are doing with others. Meetings have also served as the springboard for the beginning of local workshops and Institutes about place-based education as well as presentations at regional conferences.
For more information about this network, go to the PBENW Blog at: http://placebasededucationnw.blogspot.com/p/history.html
by editor | Jun 12, 2014 | K-12 Classroom Resources
Middle School Students Use Historic Snowpack Data to Gain Inquiry, Graphing and Analysis Experience
by Joe Cameron
Beaverton Middle School teacher

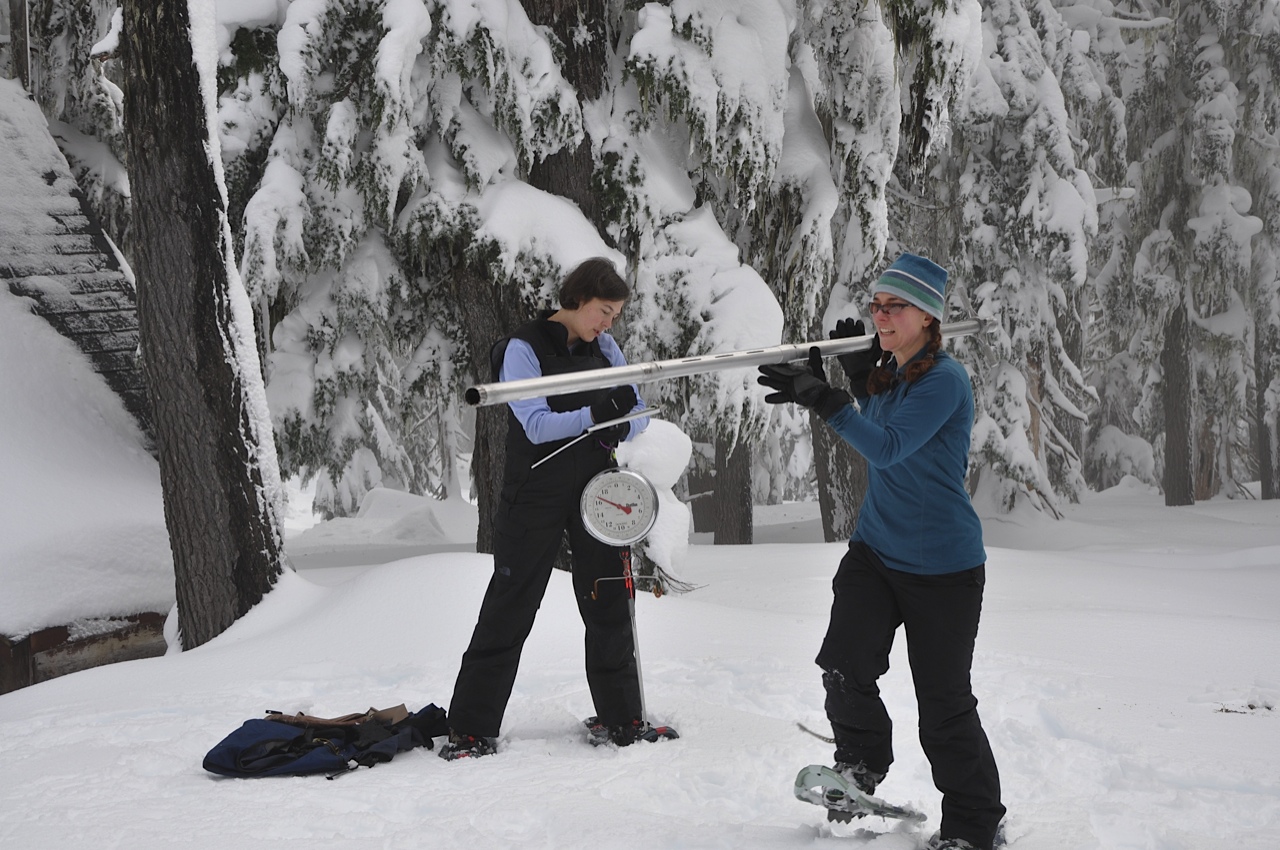
NRCS Oregon hydrologists Melissa Webb and Julie Koeberle measure snow on Mt. Hood. Courtesy of USDA.
What do you get when you mix researchers, teachers, authentic science opportunities and a group of GREAT people? You get three summers of intense work, reinvigorated teachers, new ideas for the classroom and lots of fun!
For the last three summers I was lucky enough to be involved in the Oregon Natural Resource Education Program’s (ONREP) Climate Change Institute where teachers are matched with researchers to bridge the gap between the classroom and field research. The last two years I worked with Oregon State University’s Dr. Anne Nolin and Travis Roth examining snow pack changes in the McKenzie River Watershed. Investigating snow collection sites and collecting data led to discussions on how best to get students involved in authentic research and science inquiry investigations.
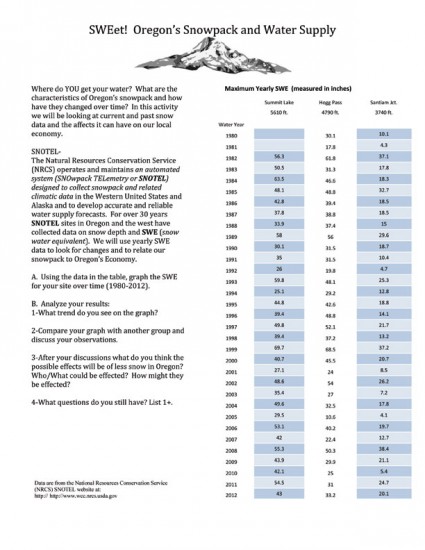
Handout for activity below.
One of my goals for the year was to get my students involved in authentic data collection and to gain more experience and practice in graphing. From this, SWEet! was born. SWEet is an activity that engages students in using historic snow data to investigate the SWE, or Snow Water Equivalent, and the changes taking place in the Cascade Mountains in Oregon. Students graph and analyze data from SNOTEL sites and compare their findings with others in class to make predictions about future snowpack. In extension activities students choose their own SNOTEL sites in the Western U.S. and monitor snow data monthly throughout the snow year. This type of activity will in turn introduce students to long-term ecological studies in progress and support them to begin studies of their own.
In doing this activity with my students we first investigated their particular sites. I found this helped them personalize the data and they were very involved, especially using this “local” data. Then using their data they were able to create comparative line graphs and look for trends in the data, even with a complex and varied data set. These trends were then used to hypothesize possible effects of changes in the snowpack to their world and the economy and ecosystems found in Oregon.
SWEet! Oregon’s Snowpack and Water Supply
Author: Joe Cameron
Time: 50+ minutes
Grade Level: 6-12
Background
SNOTEL-The Natural Resources Conservation Service (NRCS) operates and maintains an automated system (SNOwpack TELemetry or SNOTEL) designed to collect snowpack and related climatic data in the Western United States and Alaska in order to develop accurate and reliable water supply forecasts. For over 30 years, data on snow depth and SWE (Snow Water Equivalent) have been collected from SNOTEL sites throughout the western US. This activity will use yearly SWE data from three SNOTEL sites in Oregon to look for changes and relate our snowpack to Oregon’s economy and environment.
Introduction
Familiarize students with Snow Water Equivalent (SWE), which is the amount of water contained in the snowpack. A simple reference for background information is http://www.nrcs.usda.gov/wps/portal/nrcs/detail/or/snow/?cid=nrcs142p2_046155. Also, you can do a simple class demonstration by taking a 500ml beaker of snow (or blended ice) and melting it using a hot plate. I have students predict how much water will remain after the ‘snow’ is melted. Then, we calculate the percent water in the snow to give them an example of one way to analyze this type of data.
After getting the students comfortable with SWE, you can give them the SWEet! Oregon’s Snowpack and Water Supply activity page. When I led this activity, we read through the introduction as a class and then directed the students to graph the data provided, make sense of their plot, compare their results with others in class and then draw conclusions. This lesson leads to discussions of our changing climate and possible changes in store for the people, plants and animals of Oregon.
Objectives
Students will access long term ecological data.
Students will graph SWE data.
Students will compare their data with data from their classmates.
Students will identify possible effects of a decrease in snowpack.
Vocabulary
SWE-Snow Water Equivalent; the amount of water found in snow.
SNOTEL-automated system that records snow depth and related data in the western United States
Trend-a general direction that something is changing
Snowpack-the amount of snow that is found on the ground in the mountains; usually measured at specific sites.
Standards
Next Generation Science Standards (NGSS)
MS-ESS2-5. Collect data to provide evidence for how the motions and complex interactions of air masses results in changes in weather.
MS-ESS3-5. Ask questions to clarify evidence of the factors that have caused the rise in global temperatures over the past century.
Oregon Science Standards
Scientific Inquiry: Scientific inquiry is the investigation of the natural world based on observations and science principles that includes proposing questions or hypotheses, designing procedures for questioning, collecting, analyzing, and interpreting multiple forms of accurate and relevant data to produce justifiable evidence-based explanations.
Interaction and Change: The related parts within a system interact and change.
6.2E.1 Explain the water cycle and the relationship to landforms and weather.
7.2E.2 Describe the composition of Earth’s atmosphere, how it has changed over time, and implications for the future.
7.2E.3 Evaluate natural processes and human activities that affect global environmental change and suggest and evaluate possible solutions to problems.
8.2E.3 Explain the causes of patterns of atmospheric and oceanic movement and the effects on weather and climate.
8.2E.4 Analyze evidence for geologic, climatic, environmental, and life form changes over time.
Materials
For Demonstration:
1 500 ml beaker
1 50-100 ml graduated cylinder snow OR chopped/blended ice
1 hot plate
For Activity:
Copies of SWEet! Oregon’s Snowpack and Water Supply activity page
Graph paper
Optional: colored pencils/pens
Lesson Procedure
1. Give students the SWEet! Activity page.
2. As a class, read and review all directions.
3. Students may choose 1, 2, or 3 sets of data to graph. This option allows the activity to be modified to meet the individual students’ abilities. Also, students can create graphs that can be compared to multiple data sets.
4. Students graph the data in a line graph.
5. Students analyze the data. This part can be completed through drawing a trend line(s) on the graph, calculating averages, adding totals and/or comparing multiple data sets looking for similarities and differences. Note: having the students do their graphing using Excel spreadsheets is an option that is not always available in our school but from which the students would benefit.
6. Relate the observed trends in snowpack to possible effects in Oregon. Who/What will be affected? How will/might they be affected?
7. Students pose one other question OR concern they have after looking at their graphs and trends for possible additional exploration.
Extensions
1-Related current event articles from Science Daily:
Warming Climate Is Affecting Cascades Snowpack In Pacific Northwest
Found at http://www.sciencedaily.com/releases/2009/05/090512153335.htm
Global Warming to Cut Snow Water Storage 56 Percent in Oregon Watershed
Found at http://www.sciencedaily.com/releases/2013/07/130726092431.htm
2-Students can access current snow year data online. They go to SNOTEL website, choose a specific site and collect daily, weekly or monthly data for this site throughout the winter months (the snow year stretches from November to March). Students can also access historic data going back to the late 1970’s and early 1980’s for their sites.
References Science expertise was provided by the following Oregon State University Faculty: Dr. Anne Nolin – Professor and Travis Roth-Doctoral Student in the College of Earth, Ocean, and Atmospheric Sciences. Data are from the National Resources Conservation Service (NRCS) SNOTEL website at: http://www.wcc.nrcs.usda.gov
Acknowledgements These lessons were created using information learned in the Oregon Natural Resource Education Program’s Researcher Teacher Partnerships: Making Global Climate Change Relevant in the Classroom project. This project was supported by a NASA Innovations in Climate Education award (NNXI0AT82A).
Thanks to Dr. Kari O’Connell with the Oregon Natural Resources Education Program at Oregon State University and Dr. Patricia Morrell in the College of Education at University of Portland for their thoughtful review of this article.
Joe Cameron is a teacher at Beaverton Middle School in Beaverton, Oregon. He can be contacted at joe_cameron@beaverton.k12.or.us

 The Power of One
 Adeline was eleven years old and had just graduated from Primary Six in Indonesia when she first got involved with protecting the environment. “I think the most important environmental issue that we face in Indonesia and the world today is Climate Change, which has already disrupted our environment and communities,” she says, “Disasters such as floods, drought, and sinking islands could become more frequent and more severe. Those concerns encouraged me to start asking children to understand, commit and act to save our Earth.”
 Planting Trees in a Fragile Land
 Adeline says she feels honored that she was awarded first place in the 2009 International Young Eco-Hero Awards (for ages eight to thirteen) by the San Francisco-based Action for Nature, a non-profit organization that aims to inspire young people to take action for the environment and protect the natural world in their own neighborhood and around the globe. She was also selected as an Indonesian Delegate by UNEP (United Nation Environment Programme) to participate in the 2009 TUNZA International Children’s Conference in Daejon, Korea in August 2009.
 Helping Rural Families


